Formulas etc Flashcards

1
Q

Prevalence of disease

A

of cases/# of people observed at one time point

2
Q

Risk of disease

A

of new cases/ # of people followed

3
Q

Incidence of disease

A

of new cases/sum of follow up time for everyone observed

4
Q

Rate

A

Has time on the denomintor

Incidence and mortality rate are both rates

5
Q

Definition of a cause of a disease

A

An antecedent event, condition or characteristic that was necessary for the occurrence of the disease at the moment it occurred, given that other conditions are fixed

An antecedent event, condition, or characteristic without which the disease event either would not have occurred at all or would not have occurred until some time later

6
Q

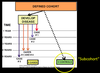
Prevalence v. incidence

A
7
Q

Cross-sectional study

A

Study of exposure-disease association in which prevalent exposure and disease status are ascertained

All done at one point in time

8
Q

Problems with cross-sectional study

A

Subject to reverse causation: because exposure & disease are determined simultaneously, not sure if your exposure causes your outcome or your outcome causes your exposure

  • *Disease prevalence** rather than incidence is measured:
  • excludes those who died before sampling
  • selects for those with mild disease
9
Q

Cohort study

A

A sutdy of exposure-disease association in which baseline exposure and incident cases of disease are measured among study participants who are non-diseased at baseline

10
Q

Approach to analyzing a cohort sutdy

A

Measure incidence of disease in exposed and in unexposed

Compare these two incidence rates

11
Q

Rate ratio

A

Incidence of disease among exposed divided by incidence of diseased among unexposed

Abbreviated as RR or risk ratio/ relative risk

If RR=1 null

If RR<1 decreased risk among exposed

If RR>1 increased risk among exposed

12
Q

Risk difference

A

Risk among exposed - risk among unexposed

13
Q

Relative v. Absolute risk

A

Two ways of expressing the same thing

Relative risk: risk of breast cancer among drinkers is about 17% higher than the risk among non-drinkers

Absolute: among drinkers, the riks of breast cancer is about 0.05% higher per year than among non-drinkers

14
Q

Attributable risk percent

A

[Risk among exposed- risk among unexposed] / risk among exposed

Risk difference/risk among exposed

15
Q

Population attibutable risk

A

(overall rate of dz- rate of dz among unexposed) / overall rate of dz

Represents % of cases that could be eliminated from the pop if the exposure were eliminated

16
Q

Summary of different measures of association: RR, RD, ARP, PAR

A
17
Q

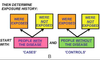
Pitfalls in cohort studies & all observational studies

A
  • *Bias**:
  • selection bias
  • information bias
  • loss to follow up

Confounding

Resource intensive: years, money, career
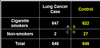
18
Q

Case-control study

A
19
Q

What measure of association can you use in a case-control study?

A

Odds ratio

20
Q

Odds

A

Probability/(1-probability)

21
Q

Odds ratio

A

Odds of exposure among case / odds of exposure among controls

Odds ratio = AD/BC

Note that odds ratio approximates the rate ratio when the disease is rare!!

22
Q

Potential problems with case-control studies

A

Confounding

Recall bias

Biased selection of controls

Interpretation of the odds ratio (when the disease is not rare)

Cannot measure incidence rates

23
Q

How can you combine case control and cohort studies?

A

Nested case control study

Case cohort study

24
Q

Nested case control study:

A

Select your cohort

Follow for those who develop disease v. not develop disease

Select your cases and controls from the two groups respectively as the study progresses

Matched on calendar time and length of follow up

Using this sampling method, odds ratios are equivalent to rate ratios

25
Q

Case cohort study design

A

Start with a cohort, follow for those who develop disase

Select your cases from those who develop disease

Select your controls RANDOMLY (note that it means some of them could have dz!) - called a subcohort

Since controls are not matched to each case, multiple case definitions can be compared tothe subcohort

Can be analyzed as a cohort study if the sampling method is taken into account

26
Q

Cohort v. case control studies

A
27
Q

4 explanations for an observed association

A

True

Chance

Bias

Confounder

28
Q

Bradford Hill Criteria for Causation in Chronic Diseases

A

Temporal relationship (exposure precedes disease)

Strength of the association (large rate ratio)

Dose-response relationship
–vs. threshold effect

Replication of the findings

Biological plausibility

Consideration of alternative explanations (threats to validity)

Cessation of exposure influences disease incidence

Consistency with other knowledge

(Specificity of the association- from one exposure comes one disease, which is falling out of favor)

29
Q

Confounder: definition

A

A factor other than exposure or disease that:

1) Is a cause of the disease
2) Is associated with the exposure
3) Does not mediate the effect of the exposure on the disease (i.e., is not “in the causal pathway” of interest)

Huge problem in observational studies

30
Q

Stratification

A

Allows us to control for confounding

•A stratified analysis is an analysis performed within “subgroups” of the study participants
–One analysis for each “level” of the subgroup
–For example:
•Analyzing associations between exposure and disease among smokers separately from associations among non-smokers
•Analyzing associations between exposure and disease among obese separately from normal weight

If an observed association goes away (or gets smaller) in stratified analyses, the observed association was confounded by the stratification variable

31
Q

Problems with stratification to control for confounding

A

Each subgroup will have fewer participants than in the overall analysis making it harder to find differences between groups

There may be potential confounders and stratification only allows control of a small number of potential confounders

32
Q

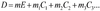
Adjusting for confounders

A

“regression models”

these can adjust for many potential confounders at the same time

dz, exposure, and potential confounders must be measured to be included in the model

each “m” is really a rate ratio or odds ratio in disguise

“m” is adjusted for all of the “covariates” in the model
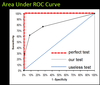
33
Q

Matching

A

Another method we can use to control for confounders

Can be used in case control study (match cases to controls) or in cohort study (match exposed to unexposed)
- match based on potential confounding factors

This is different than stratification: in stratification, we examine the association between exposure and dz within subgroups.
- in matching, we match up each case to 1 or more controls (or each exposed to 1 or more unexposed) and perform a single “matched” analysis

34
Q

Potential problems with matched analysis

A

Can’t always find matched controls (esp if you match on many variables)

Can’t study the thing you match on
- if you matched on smoking, then you can’t study whether smoking is associated with the disease

35
Q

Methods of controlling for confounding

A

During the analysis phase: stratificatoin, adjustment

During the design phase: matching, restriction, randomization

36
Q

Mediation

A

Mediators are mechanisms by which the exposure causes the disease

If you treat a mediator as a confounder (such as adjusting for a mediator), the observed association between exposure and disease will disappear

37
Q

Usefulness of stratified analysis?

A

Assess for confounding
–Effect disappears in stratified analyses

Assess for differences in the observed association between subgroups
–If the magnitude of the association varies between subgroups, we say that “effect modification” is present
–“effect modification” = “interaction”

38
Q

ROC curves

A

Receiver Operator Characteristic curves

Used for tests with continuous scale for results, such that cut off for defining + test can be set higher or lower

39
Q

Attributes of a screenable disease

A


Significant morbidity

Prevalent

Latent, asymptomatic phase (detectable preclinical period)

Treatment available

(or if contagious disease, transmission can be decreased)

Early treatment better than late treatment

40
Q

Attributes of a good screening test

A


Accurate (sensitive and specific)

Reliable

Cheap (cost effective)

Acceptable to patients (easy, non-invasive)

41
Q

Two types of bias of screening tests

A

Length bias

Lead time bias

42
Q

Length bias

A

You find the disease earlier

They die at the same time

Looks like they had a longer survival time but they really didn’t

Address this by randomization: Follow-up time from randomization (t0) to death is unbiased

(randomize before anyone gets dx)

43
Q
A
44
Q

Length bias

A

Length bias arises because screening detects more slow growing tumors relative to the proportion of slow growing to fast growing tumors in the overall population.

Slow growers stay in the screening time window longer than fast growers (who escape from cure).

It can also be addressed by randomization

45
Q

Foundational assumptions of statistics:

A

Law of large numbers:more observations, the closer it will get to truth

Central limit theorem: given large enough sample, values will be distributed normally

46
Q

Standard Deviation: SD or sigma

A

Square root of the squared differences from the mean

Measure of variation around the mean

A good way to express variation

47
Q

Standard error of the mean: SEM

A

like a SD, but it’s an estimate of variability in the population (versus SD estimates variability in your sample)

SEM= SD of the sample/square root of your sample size

It’s a measure of expected variation of the population

Can be used to make inferences when comparing the means of two groups

48
Q
A
49
Q

Null hypothessi

A

There is no differene between groups

50
Q

Alternative hypothesis

A

The groups will differ significantly

51
Q

Alpha

A

the probability of rejecting the null hypothesis when the null hypothesis is true (the probability of committing a type I error)

i.e. if alpha is .05, 5% of the time you reject the null incorrectly

52
Q

Two sided v. one sided

A

Two sided: test whether null or alternative is true: agnostic as to which one is true

One sided: that the null is true

53
Q

P value

A

This is what you compare to alpha: if it’s greater than alpha, then you do not reject the null

54
Q

Confidence interval

A

range of plasible values for an attribute of a sample

If we set alpha to .05, we should be 95% confident that the true value is included in our CI

Calculate upper and lower bounds:

Mean difference +/- 2*SE

55
Q

Type I error

A

Rejecting the null when it is incorrect to do so

Probability is an alpha level

56
Q

Type II error

A

failing to reject the null when we should

57
Q

Power

A

Probability of not committing a type II error

Determined by 3 factors: alpha level, sample size, effect size
- the larger these are, the more power we have