Stats Sem 2 Flashcards
Cross sectional studies: aka…
- Cross sectional analysis
- Transversal studies
- Prevalence studies
Cross sectional studies
- Observations
- Descriptive
- Collects data from a population at one specific time
- Groups determined by existing differences
- Can use to develop a hypothesis
- –> need to use other research designs to test hypothesis
CSS Advantages
- “snapshot” in time
- can draw on inferences from existing relationships or differences
- can use large numbers of subjects
- relatively inexpensive
- can generate
- odds ratio
- absolute risk
- relative risk
- prevalence
CSS Disadvatages
- static results
- does not randomly sample
- cannot establish cause and effect
Pearson’s product moment correlation
Measures strength of linear relationship between 2 variables
–> B=0 suggests no relationship
R2 = % variablity explained by the model
Regression modelling
- investigates whether an association exists between variables
- measures strength and direction of an association
- studies the form of relations
- Regression = explained variation
- Residual = unexplained variation
Regression - continuous outcome
Use linear or non-linear regression
Regression - catagorical outcome
Use logistic regression
Linear regression considerations
- outcome variable must be continuous
- independent variables can be categorical or continuous
Null hypothesis of linear regression
B=0, No relationship
Assumptions of linear regression
- relationship b/w DV and IVs is linear
- observations are independent and randomly selected
- homogeneity of variance
- residuals are independent and normally distributed
- effects are additive
- absence of outliers and multicollinearity
Multicollinearity
IVs that are correlated with other IVs
→ regression models may not give valid estimates of individual predictors
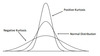
Descriptives of normal outcome
- skewness
- kurtosis (sharpness of peak)
- mean = median
→ check histogram, box-whisker and QQ plots for normality
Tests of normality
- compare shape of sample to shape of normal curve
- Kalmogorov-Smirnow used for large samples
- Shapiro-Wilk used for small samples
- p > 0.05 suggests normal distribution
Variance inflation factor (VIF)
Measure of how much variance of the estimated regression coefficient is “inflated” by existing IV correlation
VIF = 1 → no correlation among predictors
VIF > 4 → warrents further investigation
VIF > 10 → sign of serious multicollinearity
Homoscedasticity
- = constant variance
- plot of residuals scattered randomly around 0
- statistical tests
- → p > 0.05 supports constant variance assumption
Data transformations

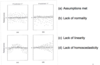
Plots to explore assumptions
Flow diagram of fitting a regression model
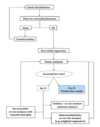
If data is not suitable for transformation or sample is small
- spearman rank-correlation coefficients
- quantile regression
Multiple regression model
Association of all IVs with DV
Cohort studies
- population identified by a common link
- research can follow across time to see what happens
- → natural history of a condition
- cohort can be divided at onset to compare experiences, compare outcome of interest
- → considers causitive/predictive factors
- followed until event occurs, compare characteristics of those with event vs others
- → identify those most likely to develop outcome
Obtaining data on exposure
- personal interviews
- questionnaire
- review of records
- medical examination or special test
- environmental survey
Exposure classification
- Exposed or non-exposed
- Degree of exposure
Comparison types
Internal comparison → one cohort sub-classified
External comparison → 2+ cohorts compared
Comparison with general population rates