What does the law of supply states?
Key points
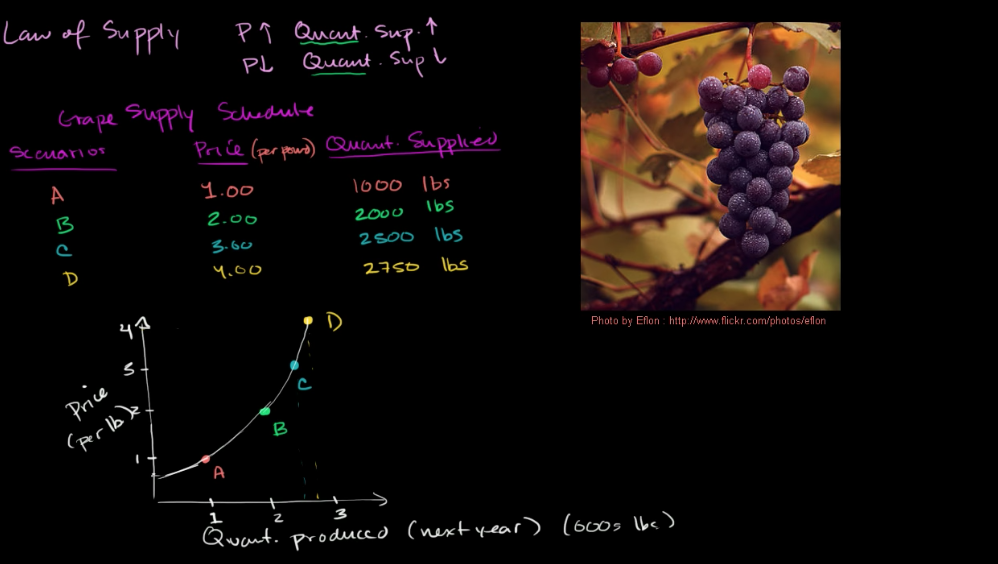
The law of supply states that a higher price leads to a higher quantity supplied and that a lower price leads to a lower quantity supplied.
Supply curves and supply schedules are tools used to summarize the relationship between supply and price.
How does supply of goods and services effect the law of supply?
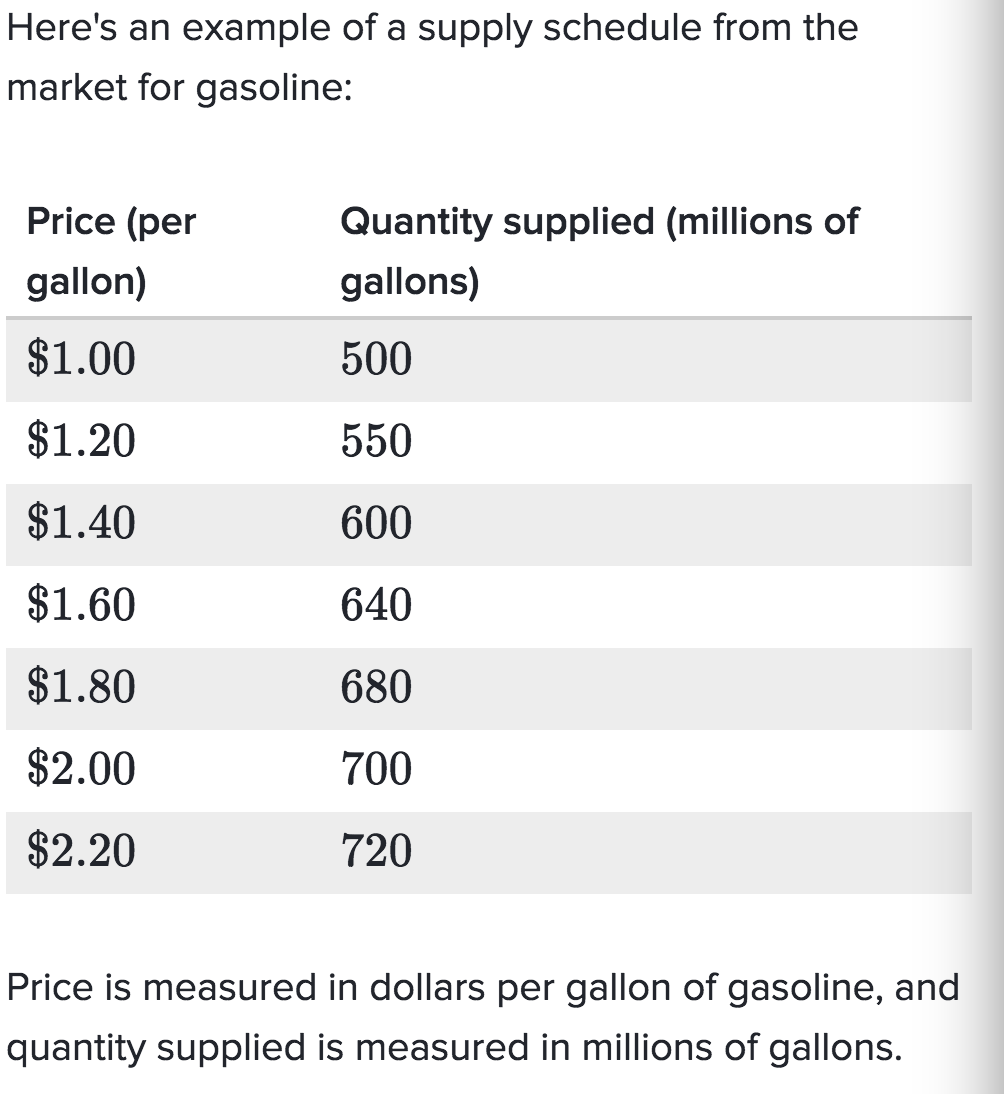
When economists talk about supply, they mean the amount of some good or service a producer is willing to supply at each price. Price is what the producer receives for selling one unit of a good or service. A rise in price almost always leads to an increase in the quantity supplied of that good or service, while a fall in price will decrease the quantity supplied. When the price of gasoline rises, for example, it encourages profit-seeking firms to take several expanding actions. Economists call this positive relationship between price and quantity supplied—that a higher price leads to a higher quantity supplied and a lower price leads to a lower quantity supplied—the law of supply. The law of supply assumes that all other variables that affect supply are held constant.
What is a supply schedule?
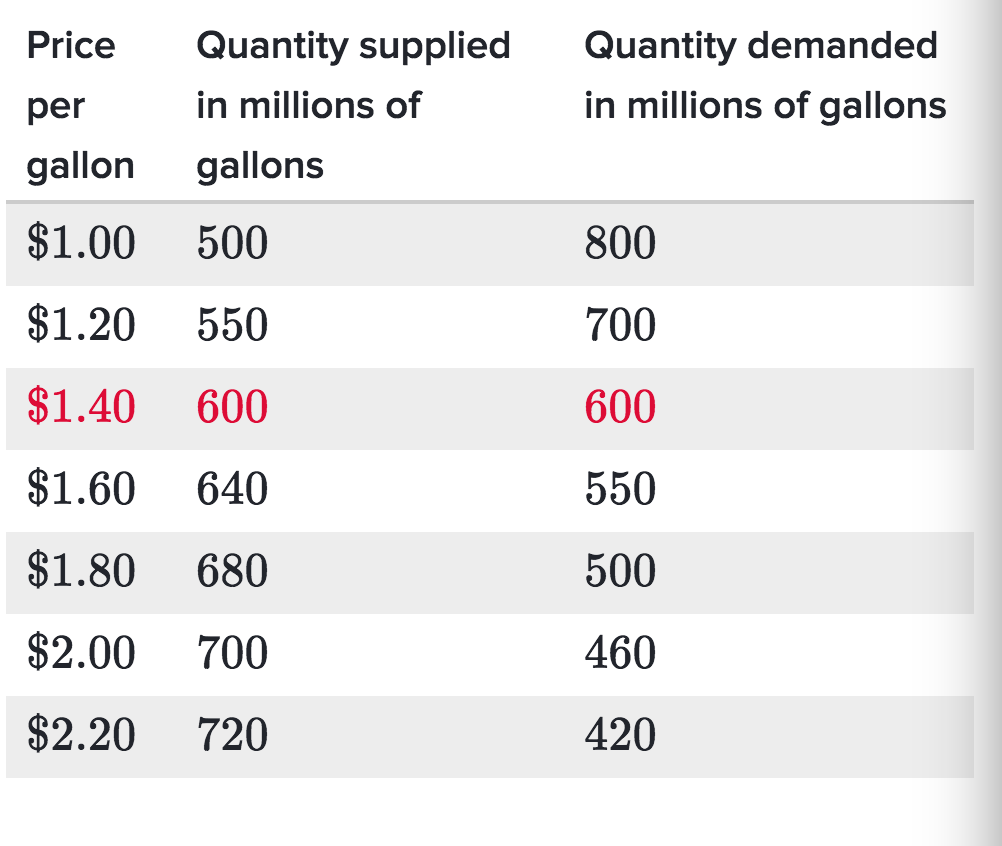
A supply schedule is a table that shows the quantity supplied at each price.
What is a supply curve?
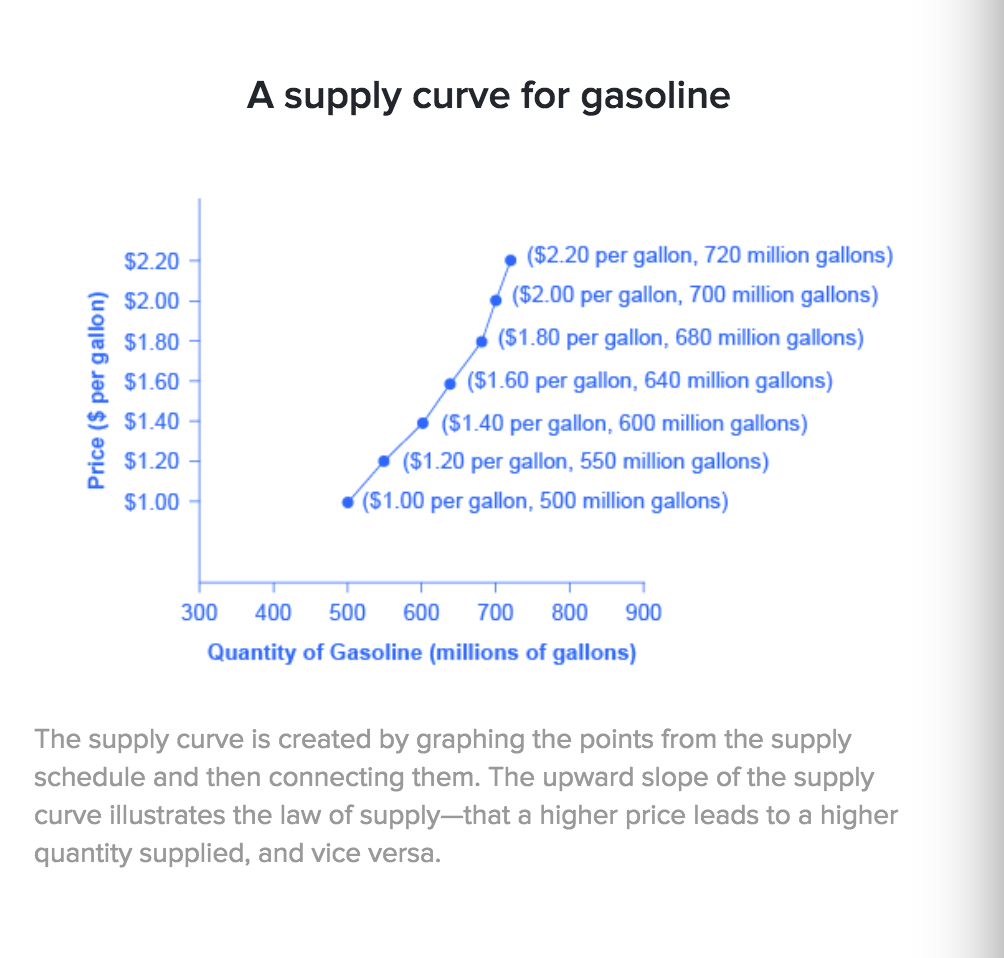
A supply curve is a graph that shows the quantity supplied at each price.
The shape of supply curves will vary somewhat according to the product: steeper, flatter, straighter, or more curved. Nearly all supply curves, however, share a basic similarity: they slope up from left to right and illustrate the law of supply. As the price rises, say, from 1 dollar per gallon to 2.2 dollars per gallon, the quantity supplied increases from 500 million gallons to 720 million gallons. Conversely, as the price falls, the quantity supplied decreases.
What is the difference between supply and quantity supplied?
In economic terminology, supply is not the same as quantity supplied. When economists refer to supply, they mean the relationship between a range of prices and the quantities supplied at those prices—a relationship that can be illustrated with a supply curve or a supply schedule. When economists refer to quantity supplied, they mean only a certain point on the supply curve, or one quantity on the supply schedule. In short, supply refers to the curve, and quantity supplied refers to a specific point on the curve.
Which factors could affect supply?
Key points
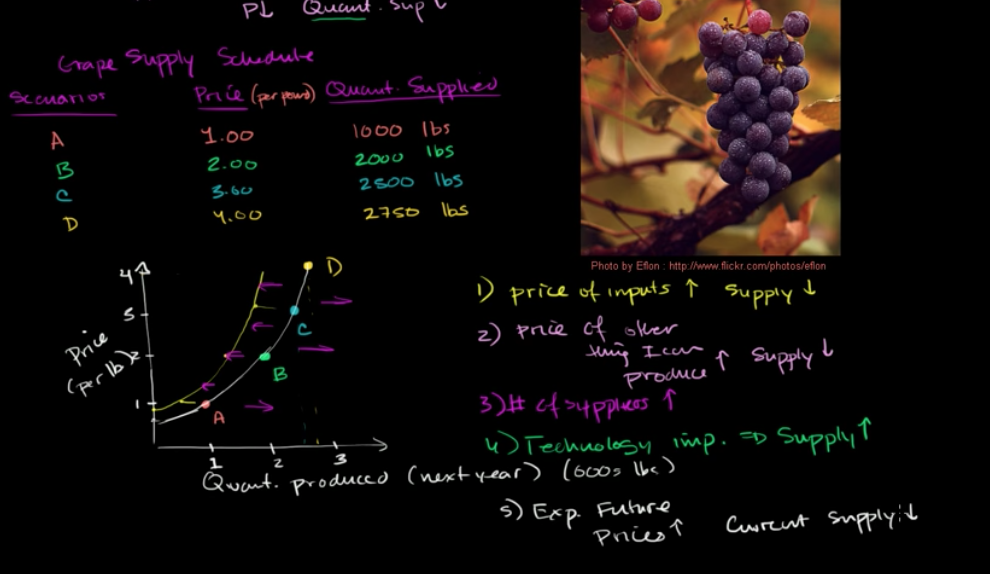
Supply curve shift: Changes in production cost and related factors can cause an entire supply curve to shift right or left. This causes a higher or lower quantity to be supplied at a given price.
The ceteris paribus assumption: Supply curves relate prices and quantities supplied assuming no other factors change. This is called the ceteris paribus assumption. This article talks about what happens when other factors aren’t held constant.
How does the ceteris paribus assumption affect supply?
A demand curve or a supply curve is a relationship between two, and only two, variables: quantity on the horizontal axis and price on the vertical axis. The assumption behind a demand curve or a supply curve is that no relevant economic factors, other than the product’s price, are changing. Economists call this assumption ceteris paribus, a Latin phrase meaning “other things being equal”. If all else is not held equal, then the laws of supply and demand will not necessarily hold. The rest of article talks about what happens when other factors aren’t held constant.
How do production costs affect supply?
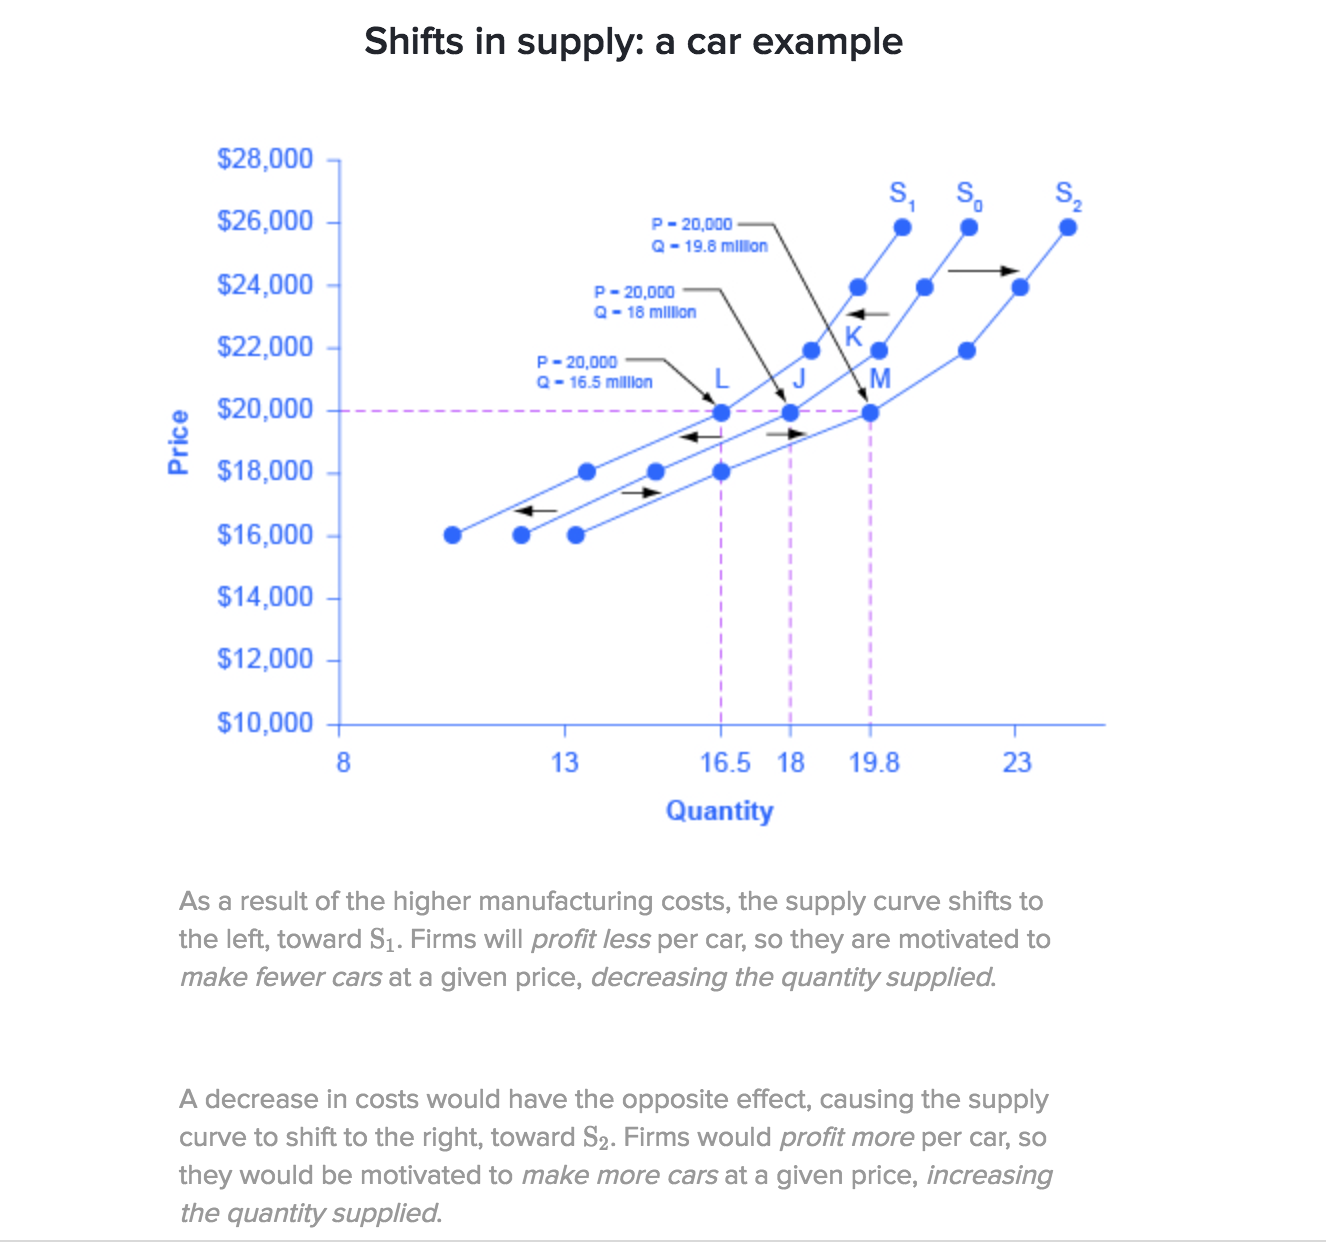
A supply curve shows how quantity supplied will change as the price rises and falls, assuming ceteris paribus—no other economically relevant factors are changing. If other factors relevant to supply do change, then the entire supply curve will shift. A shift in supply means a change in the quantity supplied at every price.
Say we have an initial supply curve for a certain kind of car. Now imagine that the price of steel—an important ingredient in manufacturing cars—rises so that producing a car becomes more expensive.
How do Natural conditions affect supplY?
In 2014, the Manchurian Plain in Northeastern China—which produces most of the country’s wheat, corn, and soybeans—experienced its most severe drought in 50 years. A drought decreases the supply of agricultural products, which means that at any given price, a lower quantity will be supplied. Conversely, especially good weather would shift the supply curve to the right.
How do new technologies affect supply?
When a firm discovers a new technology that allows it to produce at a lower cost, the supply curve will shift to the right as well. For instance, in the 1960s, a major scientific effort nicknamed the Green Revolution focused on breeding improved seeds for basic crops like wheat and rice. By the early 1990s, more than two-thirds of the wheat and rice in low-income countries around the world was grown with these Green Revolution seeds—and the harvest was twice as high per acre. A technological improvement that reduces costs of production will shift supply to the right, causing a greater quantity to be produced at any given price.
How do government policies affect supply?
Government policies can affect the cost of production and the supply curve through taxes, regulations, and subsidies. For example, the U.S. government imposes a tax on alcoholic beverages that collects about $8 billion per year from producers. Taxes are treated as costs by businesses. Higher costs decrease supply for the reasons discussed above. Another example of policy that can affect cost is the wide array of government regulations that require firms to spend money to provide a cleaner environment or a safer workplace; complying with regulations increases costs.
A government subsidy, on the other hand, is the opposite of a tax. A subsidy occurs when the government pays a firm directly or reduces the firm’s taxes if the firm carries out certain actions. From the firm’s perspective, taxes or regulations are an additional cost of production that shifts supply to the left, leading the firm to produce a lower quantity at every given price. Government subsidies, however, reduce the cost of production and increase supply at every given price, shifting supply to the right.
Sumurize factors that change supply
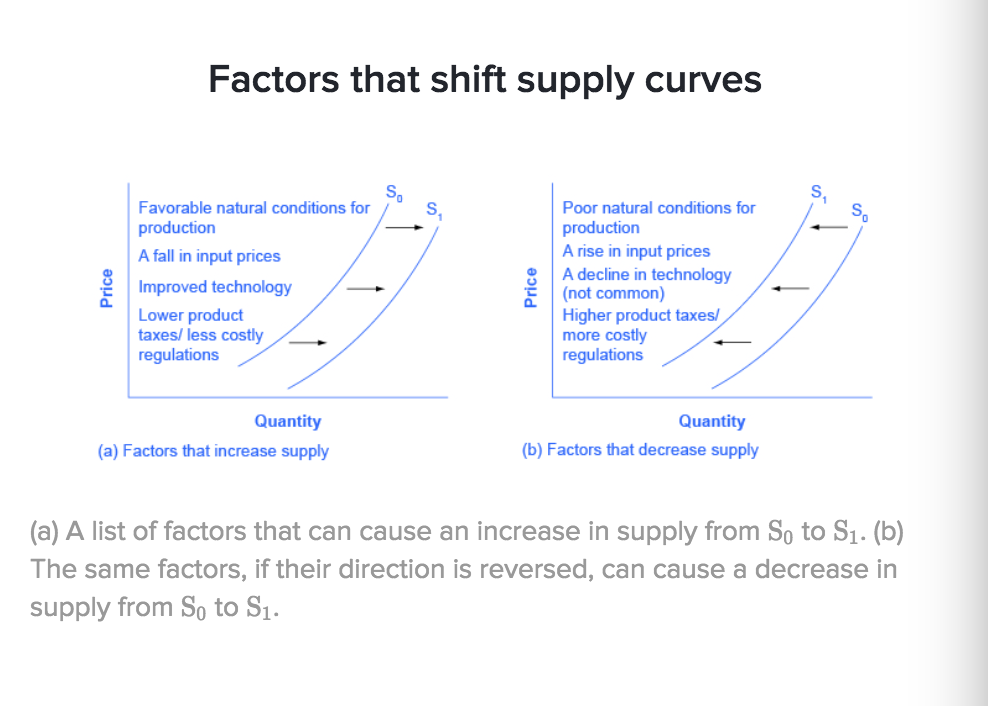
The graph below summarizes factors that change the supply of goods and services. Notice that a change in the price of the product itself is not among the factors that shift the supply curve. Although a change in price of a good or service typically causes a change in quantity supplied or a movement along the supply curve for that specific good or service, it does not cause the supply curve itself to shift.
How do long term supply curve form?
What is market equilibrium?
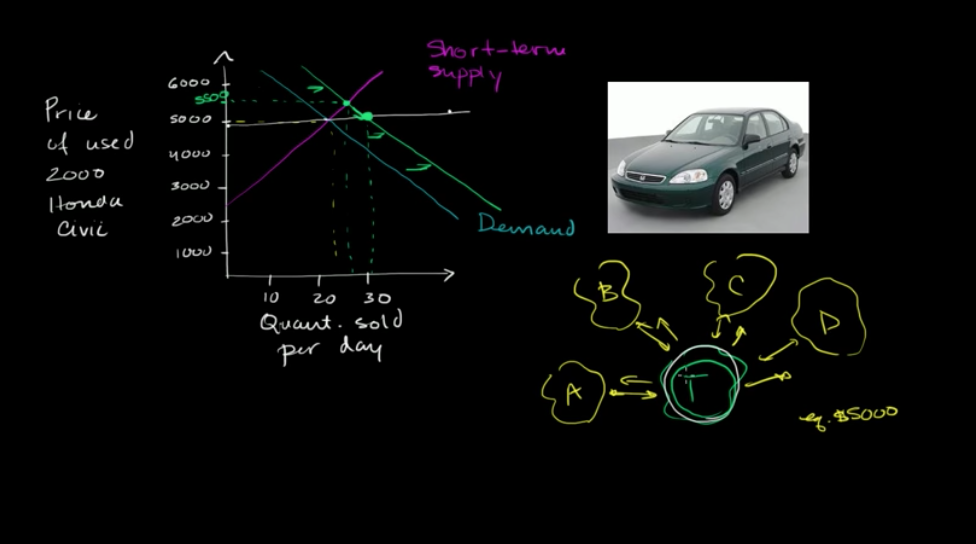
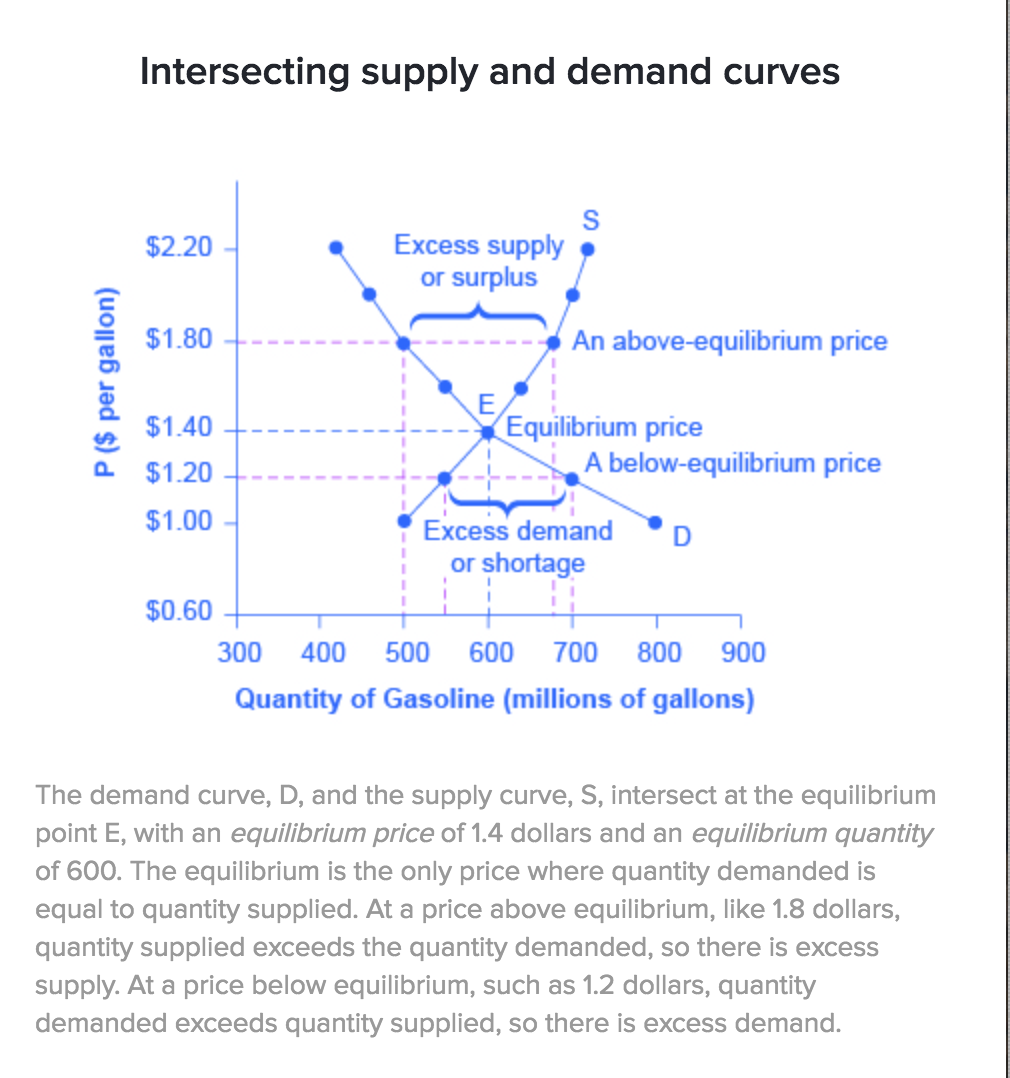
Supply and demand curves intersect at the equilibrium price. This is the price at which the market will operate
How does a demand and supply intersection look on a graph?
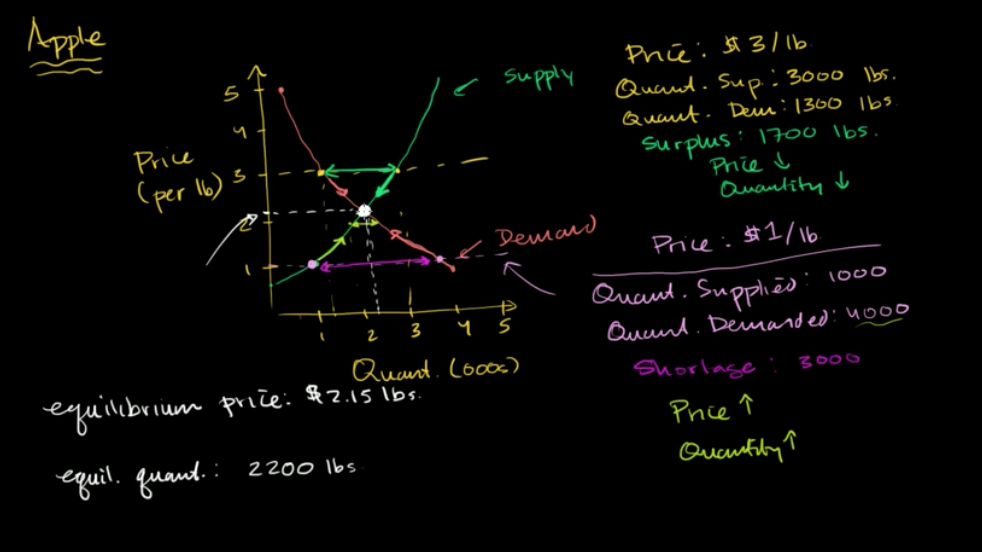
How does a equilibrium price look on a table?
The equilibrium price is the only price where the plans of consumers and the plans of producers agree—that is, where the amount consumers want to buy of the product, quantity demanded, is equal to the amount producers want to sell, quantity supplied. This common quantity is called the equilibrium quantity. At any other price, the quantity demanded does not equal the quantity supplied, so the market is not in equilibrium at that price
How do changes in the market affect its equilibrium?
What are the key points of changes in price and quantity equilibrium?
There is a four-step process that allows us to predict how an event will affect the equilibrium price and quantity using the supply and demand framework.
Step one of this process is to draw a demand and supply model representing the situation before the economic event took place.
Step two of this process is to decide whether the economic event being analyzed affects demand or supply.
Step three of this process is to decide whether the effect on demand or supply causes the curve to shift to the right or to the left and to sketch the new demand or supply curve on the diagram.
Step four of this process is to identify the new equilibrium and then compare the original equilibrium price and quantity to the new equilibrium price and quantity.
What is the first step to analyze how an economic event will affect equilibrium price and quantity?
Step 1. Draw a demand and supply model representing the situation before the economic event took place.
Establishing this model requires four standard pieces of information:
The law of demand, which tells us the slope of the demand curve
The law of supply, which gives us the slope of the supply curve
The shift variables for demand
The shift variables for supply.
Once you create your demand and supply model, you can use it to find the initial equilibrium values for price and quantity.
What is the second step to analyze how an economic event will affect equilibrium price and quantity?
Step 2. Decide whether the economic event being analyzed affects demand or supply.
In other words, does the event refer to something in the list of demand factors or supply factors?
What is the thirth step to analyze how an economic event will affect equilibrium price and quantity?
Step 3. Decide whether the effect on demand or supply causes the curve to shift to the right or to the left, and sketch the new demand or supply curve on the diagram.
You can think about it this way: Does the event change the amount consumers want to buy or the amount producers want to sell?
What is the fourth step to analyze how an economic event will affect equilibrium price and quantity?
Step 4. Identify the new equilibrium and then compare the original equilibrium price and quantity to the new equilibrium price and quantity.
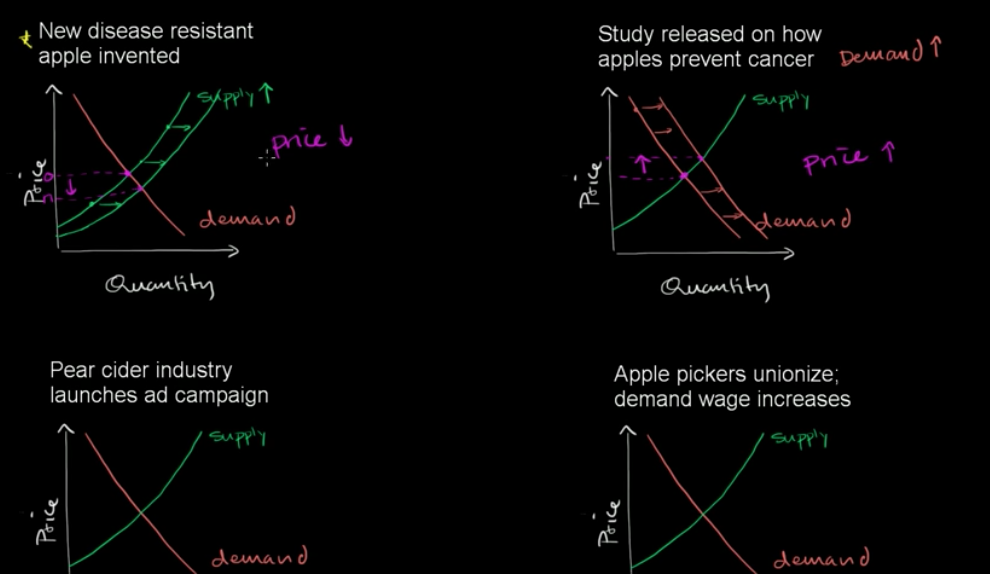
The best way to get at this process is to try it out a couple of times! Let’s first consider an example that involves a shift in supply, then we’ll move on to one that involves a shift in demand. Finally, we’ll consider an example where both supply and demand shift.
