Theory and problems d&sintro/demand/firm/mktstruc Flashcards
Explain the principles of demand fuction and supply fuction, as well as a demand (supply) curve, and law of demand (supply)
A demand function provides the qunaitiy demanded as a function of price of the good or service, the prices of related goods or services, and some measure of income.
A supply function provides the quantity supplied as a function of price of the good or service, the prices of productive inputs, and depends on the technology used to produce the good or service
Using values of all the variables other than price and inverting a demand (supply) functin produces a demand (supply curve)
The quantity supplied is greater at higher prices (law of supply).
The quantity demanded is greater at lower prices (law of demand).
Describe the difference between movements and shifts along demand and supply curves
What are causes of shifts in the demand (supply curve)
A change in the quantity demanded (supplied) in response to a change in price represents a movement along a demand (supply) curve, not a change in demand (supply)
Changes in demand (supply) refer to shifts in a demand (supply) curve.
Demand is affected by changes in consumer tastes and typically increases (shifts to the right) with increases in income, increases in the price of substitue goods, or decreases in the price of complementary goods
Supply in creased (shifted to the right) by advances in production technology and by decreases in input prices (prices of factors of production)

Describe the process of aggregating demand and supply curves, the concept of equilibrium, and mechanisms by which markets achieve equilibrium
The aggregate or market demand (supply) function is calculated by summing the quantities demanded (supplied) at each price for individual demand (supply) functions.
In free markets, the equilibrium price is the price at which the quantity demanded = the quantitiy supplied
When market price is greater than the equilibrium, the Qs > QD, and competition between among suppliers for sales will drive the price down to equilibrium
When market price is less than equilibrium price, the QD > QS and competition for the product among buyers will drive the price up to equilibrium

If 10,000 consumers have the demand function for gasoline:
QDgas = 10.75 - 1.25Pgas + 0.02I + 0.12PBT - 0.01Pauto
where income and car price are measured in thousands, and the price of bus travel is measured in average dollards per 100 miles traveled. Calculate the market demand curve if the price of bus travel is $20, income is $50,000, and the average automobile price is $30,000. Determine the slope of the market demand curve.
Market demand is:
QDgas = 107,500 - 12,500Pgas + 200I + 1,200PBT - 100Pauto
Insert values
QDgas = 107,500 - 12,500Pgas + 200 * 50 + 1,200 * 20 - 100 * 30
QDgas = 138,500 - 12,500Pgas
Invert
Pgas = 11.08 - 0.00008QDgas
slope of demand is -0.00008
Distinguish between stable and unstable equilibria and identify instances of such equilibria
A stable equilibrium is one for which movement of the price away from its equilibrium level results in forces that drive the price back towards equilibrium
An unstable equilibrium is one for which a movement of the price away from its equilibrium level results in forces that move the price futher from its equilibrium
If the supply curve is downward sloping and less steep than the demand curve, it is unstable

Calculate and interpret individual and aggregate demand, inverse demand and supply functions and interpret individual and aggregate demand and supply curves
Calculate and interpret the amount of excess demand or excess supply associated with a non-equilibrium price
To calculate individual demand, insert the values into the function (i.e. QD = 2,000 - 125P)
To calculate aggregate demand, add functions together (i.e. if there are 50 consumers; QD = 50*5,000 - 50*125P)
Inverse demand, solve for P. You can also find the P if you have the function for QD and Qs, make them equal to eachother
To calculate excess demand, solve the QD and QS functions and take the difference
Describe the types of auctions and calculate the winning price(s) of an auction
common value auction, private value auction, ascending price auction, sealed bid auction, second price sealed bid auction, descending price auction
Common value auction, i.e. oil lease auctions. Bidders must estimate what the value is, the bidder who overestimates the value of the lease is the winner
Private value auction i.e. auction of art or collectibles, bidder places a value on the item
Ascending price auction or English auction, bidders can bid an amount greater than the previous high bid
Sealed bid auction, each bidder provides one bid, highest bid wins
Second price or Vickrey sealed bid auction, the bidder submitting the highest bid wins the item but pays the amount bid by the second highest bidder
Descending price auction or dutch auction begins with a price greater than any bidder will pay and is reduced until a bidder agrees to pay it i.e. shares buyback
Calculate and interpret consumer surplus, producer surplus, and total surplus
The difference between the total value to consumers of units of a good that they buy and the total amount they must pay is called consumer surplus
Producer surplus is the excess of the market price above the opportunity cost of production (supply curve); total revenue minus the total variable cost of producing those units

Analyze the effect of government regulation and intervention on demand and supply:
price ceiling / price floor
quota, subsidy
tax
Imposition of an effective maximum price (price ceiling) by the government results in excess demand, while imposition of an effective minimum price (price floor) results in excess supply
Imposition of an effective quota reduces supply. Payment of a subisdy to producers increases supply.
Imposition of a tax on suppliers reduces supply. Imposition of a tax on consumers reduces demand.
Forcast the effect of the introduction and the removal of a market interference (i.e. price floor or ceiling) on price and quantity)
Imposition of a price ceiling will reduce the price and decrease the traded quantity to the quantity supplied at the reduced price (i.e. rent control)
Imposition of a price floor will increase price and decrease the traded quantity to the quantity demanded at the increased price (i.e. minimum wage)
Imposition of taxes on either producers or consumers will increase price (including tax) above the previous equilibrium, decrease price (excluding tax) below the previous equilbrium level, and decrease the traded quantity to the same amount in either case

Calculate and interpret price, income, and cross-price elasticities of demand and describe factors that affect each measure
Price elasticity is a measure of the responsiveness of the quantity demanded to a change in price
- when there are few or no good subsititues for a product, inelastic (i.e. drugs) and v.v.
Income elasticity is the sensitivity of quantity demanded to a change in income (i.e. normal goods and inferior goods)
Cross price elasticity of demand is the sensitivity of quantitiy demanded of one good, to the price change in a related goods
substitutes have positive elastiticy i.e. two brands of bread
compliments have negative elasticity i.e. cars and gasoline
From the demand curve, calculate the price elasticity at a gasoline price of $3 per gallon
QDgas = 138,000 - 12,500Pgas
Calculate QDgas
= 138,000 - 12,500(3) = 101,000
EDemand = %ΔQ / %ΔP = (ΔQ/Qo)(ΔP/Po) = Po/Qo *ΔQ/ΔP
= (3/101,000)(-12,500)
=-0.37
For the demand function, at a price and quantity of $3 per gallon and 101,000 gallons, demand is inelastic
An individual has the following demand function for gasoline:
QDgas = 15 - 3Pgas + 0.02I + 0.11PBT - 0.008Pauto
Assuming the average automobile price is $22,000, income is $40,000, the price of bus travel is $25, and the price of gasoline is $3, calculate and interpret the income elasticity of gasoline demand and the cross price elasticity of gasoline demand with respect to the price of bus travel.
Income elasticity
QDgas = 15-3(3) + 0.02(income in thousands) + 0.11(25) - 0.008(22)
QDgas = 8.6 + 0.02(income in thousands)
The slope term on income is 0.02, and for an income of 40,000, QDgas = 9.4 gallons
%ΔQ / %ΔI = (Io / Qo)(ΔQ / ΔI)
(40/9.4)(0.02) = 0.085
For a 1% increase/decrease in income will lead to a 0.85% increase/decrease in the QDgas
Cross-elasticity
QDgas = 15 - 3(3) + 0.02(40) + 0.11PBT - 0.008(22)
QDgas = 6.6 + 0.11PBT
QDgas = 6.6 + 0.11(25) = 9.35 gallons
%ΔQ / %ΔPBT = (PBT / Qo)(ΔQ / ΔPBT) = 25/9.35 * 0.11 = 0.294
Gas and bus travel are substitutes so the cross price ealsticity of demand is positive. 1% change in the price of bus travel will lead to a 0.294% change in QDgas in the same direction
Describe consumer choice theory and utility theory
Utility theory explains consumer behaviour based on preferences for various alternative combinations of goods, in terms of the relative level of satisfaction they provide i.e. bundle of goods
Consumer choice theory relates consumers’ wants and preferences to the goods and services they will actually buy
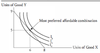
Describe the use of indifference curves, opportunity sets, and budget constraints in decision making
Calculate and interpret a budget constraint
Indifference curves plot the combinations of two goods that provide equal utility to a consumer. The slope of the curve is known as the marginal rate of substitution. Rules are as follows:
- Indifference curves for two goods slope downwards
- Indifference curves are convex towards the origin
- Indifference curves cannot cross i.e. if U(B) = U(A), and U(B) = U(C), then U(A) = U(C)
A budget contraint can be constructed based on the consumer’s income and the prices of the available goods. The area under the budget contraint is the combinations that are also affordable, known as the opportunity set.

Determine a consumer’s equilibrium bundle of goods based on utility analysis
The optimal consumption bundle for a consumer is the point where the indifference curve I1 is tangent to the budget line. This is the most preferred affoardable conbination of Good X and Good Y.
Compare substitution and income effects
The substitution effect always acts to increase the consumption of a good that has fallen in price, while the income effect can either increase or decrease consumption of a good that has fallen in price
If the substiution effect is positive and the income effect is positive, consumption of Good X will increase
The substitution effect is positive and the income effect is negative, but smaller than the substituion effect, consumption of Good X will increase
The substitution effect is positive, and the income effect is negative and larger than the substitution effect, consumption of Good X will decrease
Distinguish between normal goods and inferior goods, and explain Giffen goods and Veblen goods in this context. State 2 differences between them.
A normal good is one for which the income effect is positive
An inferior good is one for which the income effect is negative
A Giffen good is an inferior good for which the negative income effect outweighs the positive substitution effect when price falls. Is theoretical and has an upward sloping demand curve. At lower prices, a smaller quantity would be demanded
A Veblen good is one for which a higher price makes the good more desirable (i.e. Gucci bag)
2 differences:
- Giffen goods are inferior goods (negative income effect) while Veblen goods are not
- Giffen goods are theoretical and supported by the rules of consumer choice, while Veblen goods are not
Calculate, interpret, and compare accounting profit, economic profit, normal profit, and economic rent
Accounting profit is net income; total revenue - total accounting (explicit) costs. Includes short-term debt but not payments to shareholders
Economic profit is abnormal profit is equal to accounting profit less implicit costs. Implicit costs are opportunity costs such as owner supplied capital or time and entrepreneurial ability of the firm’s owners
Normal profit is the accounting profit that makes economic profit zero
Economic rent is a payment to a resource in excess of the minimum payment to retain resources in their current use i.e. rent for land, the supply for land is fixed, so that supply is inelastic
Normal profit is a minimum requirement for a firm to continue operating in the long run

Given the demand curve for a firm’s product below, calculate the total revenue, average revenue, and the marginal revenue for the first through the eighth unit and draw the marginal revenue curve over this range.

Calculate and interpret total, average, marginal, fixed, and variable costs
Total fixed costs is the cost of inputs that do not vary with the quantity of output and cannot be avoided over the period of analysis (i.e. property, plant, equipment, interest on debt, wages etc.). Remain the same with increased output.
Total variable cost is the cost of all inputs that vary with output over the period of analysis (i.e. wages, raw materials). Increase with greater output.
Total cost is the sum of fixed and variable costs
Marginal costs is the addition to total cost of producing one more unit (change in total cost / change in output). Costs can be total, fixed, or variable.
The vertical distance between TC and TVC is equal to TFC

Determine the and describe the breakeven and shut down prices of production under imperfect competition
under imperfect compeitition (price seeker), AR does not equal price so we look at total cost and total revenue (MR < P)
TR = TC; break even
TC > TR > TVC; firm should continue to operate in the short run but shut down in the long run
TR < TVC; firm should shut down in the short run and the long run

Explain how economies of scale and diseconomies of scale affect costs
Economies of scale is the downward sloping segment of the long-run average total cost curve. Economies of scale result from factors such as labor specialization, mass production, and investment in efficient equipment and technology, and cost reduction
Disceconomies of scale is the upward segment of the LRATC. This may result from increasing bureaucracy of larger firms, problems motivating a larger workforce, barriers to innovation and entrepreneurial activity. A firm here will want to decrease the size of operations and ove back towards the minimum efficient scale (i.e. US auto industry)

Describe approaches to determining the profit-maximizing level of output under perfect competition
under perfect competition, price = MR = AR
A firm can determine its profit-maximizing output by either comparing total cost to total revenue or by comparing marginal cost to marginal revenue. Profit can be maximized by:
- Producing up to a point where MR = MC and not producing additional units for which MR < MC
- Producing the quantity for which TR - TC is at a maximum

Calculate and interpret total, marginal, and average product of labour.
Total product of labour is the output for a specific amount of labour
Average product of labour per worker (or other unit of labour input) is the total product of labour divded by the number of workers (or units of labour employed)
Marginal product of labour is the addition to the total product of labour from emplying one more unit of labour
average product is a measure of overall efficiency, marginal product is the measure of productivity of an individual worker
* product is shirts and marginal/average product is per worker

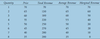
Consider the following data for Centerline Industries. The firm’s inputs can be categorized as high technology equipment, unskilled labour, and highly trained workers. The MR, MP, and cost per day of the various inputs are summarized in the following table. Assume that the inputs can substitute for each other in the production process.
- Is the firm operating at the cost-minimizing levels for its inputs?
- Assuming diminishing marginal factors returns, what adjustments to its input mix, if any, should the firm make to increase profits?

- Comparing marginal product per dollar of each resource we have:
MPhigh tech / Phigh tech = 30/800 = 0.03750
MPunskilled / Punskilled = 5/160 = 0.03125
MPhigh skill / Phigh skill = 15/450 = 0.03333
Because these are not equal, the condition for cost minimization is not met
- Comparing the MRP for each resource to its price, we have:
MRPhigh tech = 30*30 = 900 Phigh tech = 800
MRPunskilled = 5*30 = 150 Punskilled = 160
MRPhigh skill = 15*30 = 450 Phigh skill = 450
The condition for the profit-maximinzing quantity of each resource, MRP = P is met only for highly skilled labour.
For high technology, the MRP (900) is greater than the unit cost (800), so the firm should employ more high tech equipment
For unskilled workers, the MRP (150) is less than the unit cost (160), so the firm should employ fewer unskilled workers
Describe the characteristics of perfect competition, monopolistic competition, oligopoly, and pure monopoly
Perfect competition is characterized by:
- Many firms, each small relative to markets (i.e. wheat)
- Very low barriers to entry into or exit from the industry
- Homogenous products that are perfect substitutes, no advertising or branding
- No pricing power (price-takers)
Monopolisitc competition is characterized by:
- Many firms (i.e. toothpaste)
- Low barriers to entry into or exit from the industry
- Differentiated products, heavy advertising and marketing expenditure
- Some pricing power (price-searchers)
Oligopoly markets are characterized by:
- Few sellers (i.e. automobile industry)
- High barriers to entry into or exit from the industry
- Products that may be homogenous or differentiated by branding and advertising
- Firms that may have significant pricing power; firms are interdependent
Monopoly is characterized by:
- A single firm that comprises the whole market (i.e. utilitites)
- Very high barriers to entry into or exit from the industry
- Advertising used to compete with substitute products
- Significant pricing power

Given the market shares of the following firms, calculate the 4-firm concentration ratio and the 4-firm HHI, both before and after a merger to Acme and Blake.
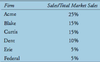
Prior to merger, conc ratio is 25+15+15+10=65%
After merger, conc ratio is 40+15+10+5=70%
Although conc ratio has only increased slightly, the market power of the largest firm has increased significantly from 25% to 40%
Prior to merger, HHI is 0.252+0152+0.152+0.102=0.1175
After the merger, HHI is 0.402+0.152+0.102+0.052=0.1950, a significant increase