1 Flashcards
(63 cards)
Null Hypothesis
Two sets of data/ results are unrelated (always true in statistics until other test done)
P Value
The probability that if the null hypothesis is true, the sample would be the same or higher as the statistical results just due to chance.
Tested to check if Probability that null hypothesis is true –> Cut off for statistical significance = 0.05
Confidence Intervals
Intervals in which the true result of test is likely to be present
When repeating the test, chances are that in 95% of the repetitions, results would be in the 95% confidence intervals
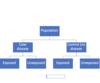
Case control and cohort studies: compare and explain the features of case-control and cohort studies, list the individual strengths and weaknesses and evaluate their appropriateness for answering research questions
Incidence
Number of new cases in a defined population within a defined period of time
(Number of new cases / total number of population)
Prevalence
Number of cases of disease within a defined population at a specific point of time (include new and pre-existing), often expressed In percentage of the total population
–> Proportion !
Mortality
The incidence of deaths in a certain time frame
Case-control studies
(way it is done + pro + con)
One Group of people with disease and one group of people without disease and they are being compared for exposure
–> Retrospective
Pro: cheap, quick, good for rare diseases, investigation for many exposures at once
Con: selection bias in choosing control, recall bias (retrospective), uncertainty of exposure-diseases-time relationship, poor for rare exposures, no direct calculation of incidence rates
Standardised mortality ratios definition + explenation
Observed deaths / Expected deaths
–> higher than 1 = higher than expected
Comparison of death rates in observed group in comparison to standard population
Cohort Studies (design, pro, con)
Select two groups –> expose one to exposure, other don’t –> see how many with/ without in each group
Prospective
Pro: Multiple outcomes, rare exposures, incidence calculation, minimization of bias in estimating exposure (prospective), natural history of disease
Con: Expensive, time-consuming, Healthy worker/volunteer bias, not for rare disease, bias when loosing follow up
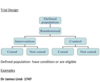
Clinical trial design
planned experiment in humans to measure the efficiency of effectiveness of an intervention
Requires:
- Control group
- prospective
- randomization
- both groups (intervention + control) followed for the same time
- ideally (double) blinded
Case-Control Studies (design, pro-con)
Compare people with disease and people without disease for exposure
Looking for cases with and without disease and then checking for exposure afterward
Retrospective
Pro:
Cheap+ quick, Suitable for rare diseases, Investigation for many exposures at once
Con:
choosing control –> selection bias, Recall bias (retrospective, the uncertainty of exposure - diseases -time relationship, Poor for rare exposures (if not many people are exposed to one thing), Can’t calculate incidence rates directly
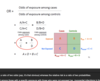
Relative risk (calculation + interpretation)
calculation + data can be collected from a cohort study:
Relative risk = incidence rate in the exposed/
the incidence rate in unexposed
RR=1 –> no difference
RR>1 –> exposure causes a higher risk for disease
RR<1 –> exposure causes lower risk for disease
–> DIVISION (vs subtraction in attributable risk)
Odds ratio (calculation + interpretation)
Can be calculated with data from Case-Control Studies
—> anhalts Punkt für relatives risikso, jedoch night so genau–> bei seltenen Erkrankungen schätzwert für relatives Risiko
odds Krank/odds gesund
Odds krank: Exposed / Nonexposed cases
Odds gesund: Exposed /Nonexposed cases
OR= no difference
OR>1 = exposure is a potential risk factor for disease
OR<1= exposure potentially protective for disease
Difference between Systematic review and meta-analysis
Systematic review: systematic collection of data
Method of providing a summary of existing data + evidence–> should be reproducible and limit bias
Metha analysis Combines statistical + quantitative analysis of data
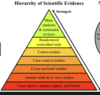
Hierarchy of scientific evidence
Attributable risk
Attributable risk= how much higher the frequency in exposed vs unexposed
Attributiutbale risk = incidence exposed - incidence unexposed
List possible causes for association
Chance
- chance might lead to a false association between exposure and disease
- Chances for testing: e.g. p values(–> chance?) and CI –> where is real value?
Bias
- systematic error in the system (design, the conduct of study)
Confounding
- a third factor that gives false association between exposure and disease
- AT trial design this can be influenced by Randomization and matching (same age, sex etc in case-controls)
Causation
List and explain the different forms of Biases
1. Selection bias
false selection of participants (e.g. different exposures in case and control group in a case-control study) 2. Recall bias
2. Recall bias
Recall of exposure is difficult, biased via false, disturbed memory of participants
3. Observer bias
more relevant in RCT, the researcher is aware of treatment given (not blinded) –> biases interpretation of results, symptoms
4. Information /measurement bias
differences in the collection of data so that there is a different quality to the data
Bradford Hill criteria
Criteria used to consider whether an association is due to causation
- The strength of association –> the stronger the more reliable
- The consistency of association –> same finding in different trial designs and different population etc.
- Specificity of association –> one to one relationship between cause and outcome
- Temporal relationship to association –> risk factor must occur during or before the disease
- Dose-response relationship –> higher dose= greater risk
- Biological plausibility–> logical explanation?
- The coherence of association–> absence of conflict with other knowledge
- Experimental evidence (reversibility) –> remove of risk factor decrease in risk?
- Analogy – other similar associations? –> absence only lack fantasy, no real association
Methods to Attempt to identify confounders
Association is due to third factor –> confounder
It can be dealt with at
- Study design
- Randomization in RCT –> confounding factor is the same in both groups
- Matching in Case-Control –> Try to match basic characteristics like sex age–> fewer confounders
- Data analysis
- Stratification –> risk is calculated individually for each variable
- Standardization –> e.g. adjusting for age structure in country etc
- Regression analysis
What are the principles of screening?
Try to detect early stages of the disease in healthy individuals
It is:
- detect people at risk
- cheap, noninvasive, simple
- healthy, asymptomatic individuals
Ideally: High sensitivity and high specificity – BUT High Sensitivity = Low Specificity
Sensitivity in screening
Ability to pick up true positives (miss as fewer people as possible)
Sensitivity = True positives / (True positives + false negatives –> all people who have disease)
Specify in screening
The ability of a test to correctly identify those without disease
Specitiy = True negatives / (True negatives + False positive)