images Flashcards
- Modality
radiologic sign
diagnosis

-
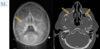
Modality:
- FLAIR (left) and DWI (right) MRI (noncontrast sequences)
- Region: brain, axial view
- Radiologic sign: hypertintense lesion representing edema and restricted diffusion in the territory of the right basal ganglions
- Diagnosis: small acute infarction
2.

-
Modality:
- DWI MRI (left) and
- 3D TOF (time-of-flight) angiography (noncontrast sequences)
- Region: brain, axial view
-
Radiologic sign:
- significant hyperintensity (representing restricted diffusion) in the right parietal lobe with concomitant abrupt filling defect at the right middle cerebral artery
-
Diagnosis:
- large acute infarction, acute thrombosis of the right middle cerebral artery
- Modality
region
radiologic sign
diagnosis

-
Modality: Non-enhanced CT, brain window setting
- (window level: 40 HU; window width: 80 HU)
- Region: Brain, axial view
-
Radiologic sign:
- (blue area) : Cortical-subcortical border disappeared/blurred due to edema
- (yellow arrow) : “hyperdense media”-sign – acute thrombosis of the right middle cerebral artery
-
Diagnosis:
- Subacute ischaemia in the territory of the right MCA
4.

-
Modality:
- Non-enhanced CT,
- brain window setting (window level: 40 HU; window width: 80 HU)
- Region: Brain, axial view
-
Radiologic sign:
- Extensive hypodense (20-25 HU) brain parenchyma,
- concomitant dilatation of the right lateral ventricle (arrows) due to brain tissue loss;
- green arrow : calcifications of the choroideal plexuses (common finding)
-
Diagnosis:
- Chronic ischemic lesion in the territory of right MCA
4.
5.

-
Modality:
- Non-enhanced CT,
- brain window setting (window level: 40 HU; window width: 80 HU)
- Region: Brain, axial view
-
Radiologic sign:
- Large hyperdense area (density: 60-70 HU) extending into the ventricles, slight midline shift to the right and compressed right lateral ventricle due to mass effect (yellow arrow)
-
Diagnosis:
- Acute cerebral apoplexy, most commonly caused by hypertensive crisis
apoplexy : unconsciousness or incapacity resulting from a cerebral haemorrhage or stroke.
6.

-
Modality:
- T2W MRI and 3D TOF angiography (noncontrast)
- Region: brain, axial view
-
Radiologic sign:
- enlarged “flow-void” on T2W MRI,
- circumscribeddilatation of the right internal carotid artery on TOF
- Diagnosis: aneurysm of theright internal carotid artery (cavernous part)
7.

- Modality: Non-enhanced CT
- Region: Brain, axial view
-
Radiologic sign:
- Cast-like hyperdensity filling the basal cisterns and sulci (normal hypodens, liquor-filled cysterns can be observed on the right image)
-
Diagnosis:
- Acute subarachnoid hemorrhage, most commonly due to a berry aneurysm rupture
8.

-
Modality:
- left –SWI axial MRI(magnitude image);
- middle –T2WI axial MRI;
- right –T1W sagittal MRI, noncontrast sequences
-
Region:
- Brain, axial and sagittal views
-
Radiologic sign:
- crescent-shaped hyperintense area on all sequences in the subdural space
-
Diagnosis:
- left-sided subdural hematoma, most commonly caused by the rupture of the bridge veins
9.

-
Modality:
- Non-enhanced CT ;
- left – brain window setting (window level: 40 HU; window width: 80 HU),
- right – bone window setting (window level: 600 HU; window width: 2800 HU)
-
Region:
- Brain, axial views
-
Radiologic sign:
- Lens-shaped hyperdense mass and skull vault fracture at the identical position (yellow arrow)
- Diagnosis: Right-sided epidural hematoma
10.

-
Modality:
- left panels –noncontrastCT,
- right panels –CE T1WI MRI (upper–sagittalview, lower–axialview) after iv. gadolinium administration
-
Region:
- Brain, axial and sagittalviews
-
Radiologic sign:
- Intraaxialparenchymal mass with rim-enhancement, which compresses the right lateral ventricle (arrow);
- MRI’s superior soft tissue resolution over CT’s is clearly oservable
- Diagnosis: Glioblastoma multiforme (GBM)
10.
11.

-
Modality:
- left – DWI MRI;
- middle – CE T1W SE with fat saturation MRI after iv. gadolinium administration;
- right – T2W fatsat MRI (axial view)
- Region: Brain, axial views
-
Radiologic sign:
- bilateral enhancing intrabulbar masses,
- restricted diffusion
- Diagnosis: bilateral retinoblastoma
12.

-
Modality:
- Non-enhanced MRI
- (left: T1WI sagittal,
- center: T2WI sagittal,
- right: T2WI axial)
-
Region:
- Lumbar spine
-
Radiologic sign:
- Btw L2/3 hypointense(signing low water content) discprotrudesinto the spinal canal (yellow arrow)
-
Diagnosis:
- Discherniation between L2 and L3 level; dehydrated disc(s)
13

-
Modality:
- left – T1W fatsat postcontrast MRI after iv. gadolinium administration;
- right – T2W fatsat MRI (sagittal view)
- Region: thoracic spine
-
Radiologic sign:
- epidural enhancing mass at the level of Th 9-12th vertebras,
- no signal loss on fatsat image;
- non-enhancing fluid signal intensity inside of the mass
- Diagnosis: epidural abscess
14

14.
Modality:
Noncontrast CT
Region:
Upper abdomen, axial views
Radiologic sign:
-Diffusely & homogenously decreased density (cca. -20 HU) of the liver
(normal density is cca. 50-60 HU).
-The vessels (blue arrows) → denser -relative to the liver parenchyma-
Diagnosis:
Steatosis Hepatis (Fatty liver)
15

-
Modality:
- Contrast-enhanced CT,
- portal phase,
- iv. iodine-based contrast agent
- Region: Upper abdomen, axial view
-
Radiologic sign:
- Multiple hypoenhancing lesions of the liver, normal spleen
- Diagnosis: Multiple liver metastases (most commonly from colon adenocc.)
-
Modality :
- Liver ultrasound with convex probe (3.5-5 MHz),
- B-mode
- Region: Liver, right subcostal view
- Radiologic sign: Hypoechoic lesions of the liver
- Diagnosis: Multiple liver metastases
16

Modality:
FDG PET-CT (right panel: non-contrast CT) → 18(F)-fluoro-deoxy-glucose
Region:
upper abdomen, axial view
- *Sign:**
- increased focal uptake in the liver
- physiological high up take in the kidney
Diagnosis:
Malignant tumor → colorectal cc. metastasis → liver
16.
17

-
Modality:
- PET-CT, 18-fluorodeoxyglucose (18F-FDG) radiotracer;
- Hybrid imaging method: PET – metabolic activity,
- CT – morphology
-
Region:
- Whole-body, coronal view
-
Radiologic sign:
- Increased fluorodeoxyglucose (18F-FDG) uptake in liver and pubic bone,
- high physiologic activity is shown in the bladder (normal finding)
-
Diagnosis:
- Multiple metastases (liver, pubic bone)
18

- *Modality:**
- left –contrast-enhanced ultrasonography (CEUS) after iv. microbubble administration (arterial phase)
- right–CEUS, late phase
Region:
liver right subcostal view
- *Radiologic sign:**
- Hepatic mass (peripheral nodular enhancement) -in the arterial phase- (L)
- complete filling in the late phase (R)
Diagnosis:
Hepatic hemangioma
19

-
Modality:
- Digital subtraction angiography (DSA), intraarterial iodine-based contrast agent; noncontrast CT (inlet)
- Region: Upper abdomen, liver
-
Radiologic sign:
- large hepatic mass in the righ lobe with intensive arterial supply, (hyperdense mass after embolization - inlet);
- selective catheterization of the right hepatic artery
-
Diagnosis:
- transcatheter arterial embolization of a giant hepatic hemangioma with Lipiodol; Lipiodol appears hyperdense on the noncontrast CT
21

-
Modality:
- left – Noncontrast CT,
- right – Contast-enhanced CT, iv. iodine-based contrast agent
- Region: Upper abdomen
-
Radiologic sign:
- Enlarged pancreas with indistinct margins;
- yellow arrow: Enhancing head – living tissue;
- red arrow : Non-enhancing body necrosis
- increased density of the surrounding mesenterial fat (fat necrosis);
- decreased liver density (see Image 14)
- Diagnosis: Acute necrotizing pancreatitis; fatty liver
20

Modality:“mDIXON” dynamic contrast-enhanced MR after iv. gadolinium
(noncontrast, arterial phase, portal phase, venous phase)
Region:
upper abdominal MR study (axial view)
- *Radiologic sign:**
- large hepatic mass
- intensive arterial enhancement
- no „wash-out”
- non-enhancing/hypointense central scar (red arrow)
Diagnosis:
hepatic focal nodular hyperplasia (FNH)
22

- *Modality:**
- Ultrasound of gallbladder with convex probe (3.5–5 MHz)
- B-mode
- *Region:**
- Gallbladder
- right subcostal view
- *Radiologic sign:**
- Yellow arrow → Echo-dense structure in the gallbladder lumen, with acoustic shadowing
- Red arrow → Thick, stratified, oedematous wall
Diagnosis:
Acute cholecystitis with gallstone
23

-
Modality:
- T2W MRI, axial plane (left);
- 3D MRCP (heavily T2-weighted sequence), coronal plane (right), noncontrast study
-
Region:
- upper abdominal MR study, axial (left) and
- coronal (right) views
-
Radiologic sign:
- filling defect in the common bile duct
- Diagnosis: choledocholithiasis
24

- *Modality:**
- yellow → Sonogram of the appendix -linear 7,5–10 MHzprobe-
- Green → convex 3,5-5 MHz probe -B-mode-
- Red: power Doppler
- *Region:**
- Appendix
- longitudinal and cross-sectional views
- *Radiologic sign:**
- -yellow →* Small amount of free periappendiceal fluid is also present (yellow arrow).
- green → Thickened (more than 6 mm), non-compressible tubular structure
- -red arrow →* showing signs of edema and hyperVascularisation
Diagnosis:
Acute appendicitis
25

-
Modality:
- left – PA chest radiograph, frontal projection (upright position);
- right – noncontrast CT, axial view
-
Region:
- Chest, upper abdomen
-
Radiologic sign:
- Crescents of radiolucency under the hemidiaphragms (red arrows),
- free air accumulation at the convexity of the liver and at the liver hilum, its density is -1000 HU (right panel, red arows);
- perihepatic and perisplenic free fluid, its density is 0 HU (yellow arrows)
- Diagnosis: Free abdominal air (due to perforation of luminal abdominal organ)
26

.Modality:
-left image → Abdominal plain radiograph, standing posture;
-right image → Contrast-enhanced CT scan, iv. iodine-based contrast agent
Region:
Abdomen and pelvis
- *Radiologic sign:**
- yellow arrows → Distended colon with air–fluid levels. In the sigmoid colon an obstructing contrast-enhancing mass
- red arrow → In the sigmoid colon an obstructing contrast-enhancing mass (conglomerate is shown)
Diagnosis:
Large-bowel obstruction caused by sigmoid cancer
27

- Modality: Barium swallow test, fluoroscopy
- Region: Esophagus
-
Radiologic sign:
- Outpouching (red arrow) filled with contrast material near the pharyngo-esophageal junction;
- air-fluid level (yellow arrow) in the outpouching;
- dilated, sclerotic aorta (green arrow);
- glass with contrast material (blue arrow)
- Diagnosis: Zenker diverticulum
28

- *Modality:**
- -**left* -Barium enema study, double-contrast method(barium and air)
- right–contrast-enhanced CT, venous phase, iv. iodine-based contrast agent
- *Region:**
- *-**Abdomen
- axial view
- *Radiologic sign:**
- *-**Annular irregular stenosis & bowel wall thickening (apple-core sign)
- Tumorous infiltration of the surrounding fat (increased density)
Diagnosis:
Colon adenocarcinoma
29

-
Modality:
- DWI MR (left),
- dynamic mDIXON contrast-enhanced MR (middle) after iv. gadolinium,
- T2W MRI (right)
-
Region:
- pelvic MR study,
- axial view (left) and
- sagittal view (right)
-
Radiologic sign:
- thickened rectal wall/intraluminal mass with intensive contrast enhancement and
- concomitant restricted diffusion (red arrow); local staging MRI
- Diagnosis: rectal adenocarcinoma
30

Modality:
Low-dose non-enhanced CT scan
- *Region:**
- abdomen
- coronal view
Radiologic sign:
JuxtaVesical hyperdensity
-in the L.Ureter
Diagnosis:
JuxtaVesical stone
31

- Modality: Contrast-enhanced CT; arterial phase
- Region: Abdomen
- Radiologic sign: Enlarged right kidney with patchy hypoenhancement
- Diagnosis: Acute pyelonephritis
- Modality: Kidney ultrasound with convex probe (3.5–5 MHz), B mode & color Doppler
- Region: Abdomen
- Radiologic sign: Enlarged right kidney shows ill-marginated central echo group and parenchymal hypovascularisation
- Diagnosis: Acute pyelonephritis (right side)
32

Modality:
-yellow: Non-enhanced CT,
the rest: Multiphase contrast-enhanced CT
(early arterial, portal and venous phase)
-iv. iodine-based contrast agent
- *Region:**
- Abdomen
- retroperitoneum
- *Radiologic sign:**
- Yellow arrow → Aortic aneurysm with wall calcifications
- Blue arrown → hypoDense wall thrombus,
- Red arrow → hyperdense retroperitoneal fluid collection
Diagnosis:
Abdominal aortic aneurysm rupture
33

-
Modality:
- aortic CT angiography;
-
Region:
- chest; left – coronal view,
- right – sagittal view, iv. iodine-based contrast agent
-
Radiologic sign:
- intima flap (yellow arrow),
- crescent-shaped false lumen (green arrow),
- oval true lumen (blue arrow).
- True lumen is denser due to its higher contrast agent concentration.
-
Diagnosis:
- Stanford A aortic dissection, affecting the left subclavian artery (red arroW)
34

Modality:
T2W MRI and dynamic contrast-enhanced MRI of the prostate
(after iv. gadolinium contrast agent administration)
- *Region:**
- Pelvis
- axial views
- *Radiologic sign:**
- Yellow → T2 hypointensity in the peripheral zone;
- Red → intensive contrast-enhencing mass in the same area
- Blue → normal central zone
Diagnosis:
prostate adenocarcinoma
35

-
Modality:
- PA (left) and
- lateral (right) chest radiograph;
- hard-beam technique (120–140 kV)
-
Region:
- chest, pleura
-
Radiologic sign:
- Decreased transparency at the right lung base showing a meniscus-shaped contour on the right side.
- Diaphragm and lateral sinuses cannot be differentiated on the right.
- Left side is normal.
- Diagnosis: Right-sided pleural effusion
36

-
Modality:
- Chest radiograph in frontal projection(PA-film)
-
Region:
- Chest, pleura
-
Radiologic sign:
- Peripheralspace is radiolucent with no lung markings(yellow arrow);
- visible visceral pleural line (blue arrow);
- partially collapsed leftlungbasis (red arrow);
- slight mediastinal shift to theright;
- left diaphragm and lateral sinus cannot be differentiated.
-
Diagnosis:
- Left-sided pneumothorax and hydrothorax
37

- Modality:
- Bedside chest radiograph (AP radiograph)
- Region: Chest, lung
- Radiologic sign:
- Decreased tranparency (consolidation) in the right upper lobe with radiolucent aerobronchogram (red arrow)
- left-sided jugular catheter, ECG electrodes
- Diagnosis:
- Right-sided lobar pneumonia in the upper lobe
38

-
Modality:
- Contrast-enhanced chest CT,
- lung window setting (right panel);
- mediastinal window setting (left panel),
- iv. iodine-basedcontrastagent
- Region: Chest, axial views
-
Radiologic sign:
- Air-containing (red arrow) fluid collection with
- thick enhancing rim (yellow arrow)
-
Diagnosis:
- Left-sided lung abscess
39

-
Modality:
- left image – PA chest radiograph (upright);
- right image – post-contrast chest CT; lung window setting, iv. iodine-based contrast agent
- Region: Chest, lung
-
Radiologic sign:
- Multiple soft tissue lesions showing different size and rounded shape (yellow arrows), number of nodules is higher at the base than the apex due to its higher perfusion.
-
Diagnosis:
- Multiple lung metastases
40

-
Modality:
- LEFT: PET-CT; 18-fluorodeoxyglucose (18F-FDG) radiotracer fused image
- Right: non-enhanced chest CT bone window, core biopsy
- Region:Chest, lung
- Radiologic sign:
- Increased18F-FDG uptake in the right apical mass;
- CT-guided core biopsy from the right apical mass
-
Diagnosis:
- Pancoast tumor, thoracic core biopsy
41

-
Modality:
- HRCT of the lung (noncontrast study), lung window
-
Region:
- Chest, lung, axial view
-
Radiologic sign:
- Bilateral dorsobasal honeycombing pattern (yellow arrow),
- traction bronchiectasis (green arrow)
-
Diagnosis:
- Pulmonary fibrosis
42

-
Modality:
- Pulmonary CT-angiography (contrast-enhanced series in pulmonary arterial phase), iv. iodine-based contrast agent
-
Region:
- Chest, axial views at the level of the pulmonary bifurcation
-
Radiologic sign:
- Large hypodense filling defects in the pulmonary arteries at both sides.
-
Diagnosis:
- Bilateral pulmonary embolism
43

-
Modality:
- Lower extremity venous ultrasound, linear probe (7,5-10 MHz),
- B-mode and Color-Doppler mode (right panel)
-
Region:
- V. femoral superficial and popliteal vein;
- Left image - transverse section,
- right image – transverse section
-
Radiologic sign:
- Veins are filled with hypoechoic thrombus, the lumen is non-compressible demonstrating no flow (lack of Doppler–signal);
- beneath the popliteal artery has normal flow signal (green arrow)
-
Diagnosis:
- Deep vein thrombosis (DVT)
44

- *Modality:**
- Digital subtraction angiography (DSA)
- Catheter angiography, intra-arterial iodine-based contrast agent
Region:
carotid bifurcation
- *Radiologic sign:**
- left image →* Significant internal carotid artery stenosis
- center image → balloon dilatation and stenting,
- right image → Control angiography, normal flow
Diagnosis:
Carotid angioplasty and stenting of a significant carotid stenosis
45

-
Modality:
- Digital subtraction angiography (DSA), Catheter angiography, intraarterial iodine-based contrast agent
-
Region:
- Lower extremity, popliteal artery
-
Radiologic sign:
- left image – Significant right popliteal artery stenosis (yellow arrow), collateral circulation;
- right image – Control angiography after balloon dilatation (NO stents were used), collateral circulation is diminished
-
Diagnosis:
- Chronic popliteal artery stenosis, balloon angioplasty (PTA)
46

- *Modality:**
- fluoroscopy
- iv. iodine-based contrast agent
- *Region:**
- *-**upper abdomen, liver
- *Radiologic sign:**
- yellow arrow → Stent
- red arrow → placement between the portal and hepatic v
- blue arrow → hepatic vein to create a lasting connection for the purpose of decreasing the portal pressure.
- *Diagnosis:**
- TIPS (transjugular intrahepatic porto-systemic shunt) in liver fibrosis
- proper contrast filling of the stent
47

-
Modality:
- ankle X-ray – lateral view (left image),
- CT 3D reconstruction (right image)
- Region: Left ankle
-
Radiologic sign:
- abrupt discontinuity of the cortex of the calcaneus, lucent fracture lines
-
Diagnosis:
- Comminuted fracture of the calcaneus. (Lover’s fracture or Don Juan-fracture)
48

- *Modality:**
- left → X-ray of the left knee in two projection
- middle → PD FS (proton density fatsat)
- right → T1W post-contrast MRI
Region:
Left knee, lateral view (radiograph), coronal views (MRI)
- *Radiologic sign:**
- Inhomogeneous destructive metaphyseal lesion of the left femur|
- red area → Periosteal reaction, Codman triangle
- radiograph→ invasion to the surrounding soft tissue is also present. - Inhomogenously enhancing metaphyseal mass infliltrating the surrounding soft tissue.
Diagnosis:
Osteosarcoma of the femur
49

-
Modality:
- bone scintigraphy with 99mTc with methylene diphosphonate (MDP) radiotracer
-
Region:
- whole body, AP and PA views
-
Sign:
- multiple foci of increased radiopharmaceutical uptake in the bones
-
Diagnosis:
- multiplex osseal metastases, scoliosis
50

Modality:
Radiograph of the left hallux in two projections
Region:
Left foot, hallux
Radiologic sign:
Marked ill-defined bone resorption in distal tuberosity (= ungual process) with significant soft tissue swelling.
Diagnosis:
Acute osteomyelitis
51
-
Modality:
- left image – X-ray of the sinuses;
- right image – noncontrast CT of the sinuses, low-dose, bone window
- Region: Maxillary region, paranasal sinuses
-
Radiologic sign:
- Right maxillary sinus shows homogenous decreased transparency,
- the left one has rounded mucous thickening
-
Diagnosis:
- Bilateral sinusitis
52

- *Modality:**
- left image → Contrast-enhanced head-and-neck CT -axial view-
- -right image →* coronal view, iv. iodine-based contrast agent
- *Region:**
- Head and neck, axial (L)
- Coronal (R) view
- *Radiologic sign:**
- -**red arrow →* Right-sided submandibular fluid collection with thick enhancing wall.
- Fluid inside the abscess has a density of 0-10 HU (shows no enhancement)
- Patient had prior wisdomtooth extraction.
Diagnosis:
Neck abscess
53

-
Modality:
- linear probe (7,5–10 MHz),
- left - B-mode US,
- middle – Color Doppler US,
- right – B-mode US
- Region: neck, thyroid gland
-
Radiologic sign:
- well-circumscribed Isoechoic vascularized nodule,
- right - FNAB (fine-needle aspiration biopsy) (yellow arrow)
-
Diagnosis:
- Suspicious thyroid nodule, cytology proves benignity
54

- *Modality:**
- Thyroid gland scintigram
- Technetium-99m (99m Tc)-pertechnetate scintigraphy
Region:
Thyroid
- *Radiologic sign:**
- yello warrow →* Focal lesion showing decreased tracer activity in the right lobe
Diagnosis:
Cold nodule
55

-
Modality:
- thyroid scintigraphy; Technetium-99m (99m Tc)-pertechnetate radiotracer
- Region: thyroid gland
-
Sign:
- Increased uptake in the left lobe of the thyroid,
- low uptake in the other parts of the gland.
-
Diagnosis:
- Hot nodule in the thyroid (toxic nodule), other parts of the thyroid are supressed.
56

Modality:
Mammography of the right and left breast, soft-beamtechnique (30 kV)
Region:
Craniocaudal (CC) views of the right and left breasts
- *Radiologic sign:**
- Soft tissue mass with spiculated contour and micro-calcifications in the right breast.
- The breast type is fatty/almost fatty, in which it is easier to detect masses than in dense breasts.
- *Diagnosis:**
- Right-sided breast cancer
- Normal left breast
57

-
Modality:
- Breast sonography with linear probe (7.5–10 MHz), B-mode
- Region: Breast, axilla
-
Radiologic sign:
- left image – well-defined anechoic lesion with posterior acoustic enhancement (btw yellow lines);
- right image – ill-defined hypoechogenic lesion with partial acoustic shadowing (btw red olines),
- “taller than wide”: solid structure, suspicious of cancer
-
Diagnosis:
- cyst (left) and
- breast carcinoma (right)
58

-
Modality:
- FAST (Focused Assessment with Sonography for Trauma) scan
-
Region:
- Abdomen, pleural sinuses, pericardium, aorta
-
Radiologic sign:
-
Free abdominal fluid in the
- hepatorenal fossa,
- around the spleen,
- among the bowel loops
- and in Douglas pouch.
- Patient sustained blunt trauma.
-
Free abdominal fluid in the
-
Diagnosis:
- Free abdominal fluid after blunt trauma, suspicious for internal hemorrhage.