Week 5.9: Transcriptomics and Proteomics Flashcards
5.9 Transcriptomics and Proteomics
- *Topic;** qRT-PCR, transcriptome sequencing, allele-specific expression, proteome prediction, 2D gel electrophoresis, mass spectroscopy
- *Reading: HGD ch11, COG 21.9, EPG ch9**
Learning outcomes
This is what you should be able to do after you complete the lecture, read around and revise the topic
<!--[if !supportLists]-->
· <!--[endif]-->Define transcriptomics and proteomics
<!--[if !supportLists]-->
· <!--[endif]-->Explain why transcriptomics and proteomics are useful and explain how they can help us understand the human genome
<!--[if !supportLists]-->
· <!--[endif]-->Describe, compare and critique the various laboratory methods for performing transcriptomics and proteomics (general principles)
<!--[if !supportLists]-->
· <!--[endif]-->Recognise some key bioinformatics aspects underpinning transcriptomics and proteomics
<!--[if !supportLists]-->
· <!--[endif]-->Describe a number of common applications of transcriptomics and proteomics
“We cannot teach people anything; we can only help them discover it within themselves” – Galileo Galilei
The transcriptome is the set of all RNA molecules, including mRNA, rRNA, tRNA, and other non-coding RNA produced in one or a population of cells**
What does the human genome do? **
The genome provides the information for cellular processes
The human genome is the complete set of genetic information for humans (Homo sapiens sapiens). This information is encoded as DNA sequences within the 23 chromosome pairs in cell nuclei and in a small DNA molecule found within individual mitochondria.
What we study is what happens with this information how it is used this is where transcriptomics and proteomics comes in.
The Central Dogma of Molecular Biology
The transcriptome is the set of all RNA molecules, including mRNA, rRNA, and other non-coding RNA produced in one or a population of cells.
What is transcriptomics?
Transcriptomics is the study of a transcriptome, specifically, transcriptomics involves the detection and quantification of the individual transcripts present in a given sample. The study of transcriptomics, also referred to as expression profiling, examines the expression level of mRNAs in a given cell population, often using high-throughput techniques based on DNA microarray technology. The use of next-generation sequencing technology to study the transcriptome at the nucleotide level is known as RNA-Seq
Why bother with transcriptomics?
The human genome is essentially unchanged throughout an individual’s life and throughout the body, the differences observed as infants grow to adults are to different development stages caused by gene regulation on expression.
If we want to understand how the genome works, we need to be able to monitor which genes are being transcribed in different situations
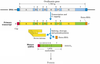
What is alternative splicing?
Alternative splicing can significantly change gene behaviour.
By splicing it in different ways, one gene can be made to produce many different mRNA sequences, and hence many different proteins.
Genomes sequencing can show us possible splice variants, but not which variants are actually produced.
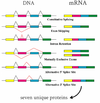
Various ways in which individual gene can be translated into mRNA – though the sequence is the same what has been done with this information is different.
This example of just one gene as potential to produce 7 unique proteins
Proteomics – is almost the next step on from transcriptomics?
The proteome is the collection of all proteins produced in one or a population of cells
Proteomics is the study of proteome, specifically proteomics involves the detection and quantification of the proteins present in a given sample.
In humans this can get complicated, we know that in the home there are between 20-25,000 genes, if we look at transcriptomics, we are looking at 100,000 transcripts, due to alternative promoters, alternative splicing and mRNA editing. Then transcripts can go through post-translational modification steps, biochemical changes, this can take you up another order of magnitude to >1,000,000 proteins that can be produced potentially
Not all transcripts are translated into proteins
What about the central dogma?
Can’t we just infer protein presence and abundance from transcripts?
Only proteomics can reveal post-translational modifications – different things can be added to them
When doing quantitation; correlation between abundance of transcripts and proteins is poor for many genes. Mostly because of protein turnover, proteins are difficult to predict because some proteins are more stable than others, so what you might find in particular samples is that there is no transcript for particular genes but you do find the protein for that gene.
Transcriptomics methods – how we do transcriptomics, how we identify and quantify transcripts
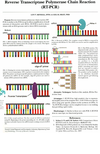
Reverse Transcription PCR
One of the earlier techniques for doing transcriptomics, or transcript analysis was reverse transcriptase PCR. It is a lot easier to deal with DNA rather than RNA, so generally what we do is used reverse transcriptase to actually convert the RNA to DNA and then we amplify it. RT-PCR is similar to PCR in that it amplifies DNA, the difference is that the cDNA template are produced by revers transcription of RNA. RT-PCR was one of the first methods to do this
Just like in normal PCR, a primer is designed to specifically bind to the sequence of interest, you use the primer to get the reverse transcriptase to bind to the RNA of the transcript you want to analyse, then the reverse transcriptase goes along the sequence and creates DNA sequence for the particular RNA you have targeted.
It is a lot easier to work with DNA because it is a lot more stable.
Then we remove the mRNA, using RNAase H enzyme, comes along and cuts off the RNA, leaving you with single strange of cDNA. Then you just do a normal PCR to amplify the cDNA.
Because of the amount of amplified cDNA produced is related to the starting amount of mRNA, this can be used for quantitation.
It is still the most sensitive method of RNA detection available today – can get down to a single copy per cell!
EXAMPLE of where Reverse Transcription PCR is used
Lesh-Nyhan disease; How transcriptomics shows us things that sequencing can’t
Lesh-Nyhan disease (LND), this is caused by a malfunction in the HPRT1 gene, which leads to a build-up of uric acid throughout the body. Gout has a similar effect but unlike Gout, LND affects people from a young age.
In many sufferers, the HPRT1 gene is mutated, causing it to malfunction.
** However, in some LND sufferers the coding sequence of HPRT1 is normal,** but the expression of the gene is decreased. Sequencing the gene therefore does not provide a definite diagnosis of the disease but measuring expression (transcriptomics) does.
Indeed, analysing a pregnant mother and for mRNA expression levels of HPRT1 will reveal if the mother is a carrier and if the fetus will be likely to develop LNS.
(Always nice to have an example for the exam ^ above example is useful can look up the paper on PubMed (PMID = 23046577)
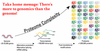
Microarrays for transcriptomics
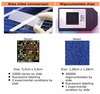
Microarrays – are a population technology for this, it is relatively new technique (has been around for 15 years) The same basic technology as for SNP genotyping, but the probes are different. The idea being you can have microarrays which are representative of your genes in your genome, and then you apply sample, then these dots are specific for a particular gene, different colours will present the different expression of the gene relative to the sample being analysed. Aim is to bind probes irrespective of individual variance. Microarrays make genome-wide transcriptomics possible. (Above is an example of two-channel glass slide microarray)
Essentially, each spot represents a gene, and the colour indicates the level of expression relative to some reference. Of course, for good science we’d have at least some replicates and may have different variants of some genes, dpending on our experimental aims.
Red = overexpressed
Green = under-expressed
Yellow = similar level of expression

In traditional microarrays, a high resolution robot spotter is used to deposit an array of tiny spots (or “probes”) individually onto a microscope slide. Each probe on the array is composed of short (25-60bp) stand of cloned single stranded cDNA specific to a particular gene.
There are samples with cancer cells and normal “healthy” cells, you do exactly what we did before in the context of reverse transcriptase technique – to produce cDNA
Then you label the cDNA with a particular fluorescent tag, mRNA from the two samples is reverse transcribed and labelled with fluorescent dyes Cy3 (green) or Cy5 (red) depending on which sample it came from.
The labelled cDNA is then mixed together, and naturally hybridises to probes on the array.
Then wash it over a microarray slide – the idea is that because we already took individual probes, anything for a specific gene is going to hybridise – this s the simple protocol behind this method
You end up with some DNA from cancer cells and some from the normal cell – then the ratio of those can be worked out by looking at the labels.

Three gene arraies, DNA from gene A B and C
Array is scanned with red light and the things that are labelled with RED dye will show up – this example is showing us that gene A was found in what sample – then green light and we get B and C

Then the combined image (this is where the computation part comes in) we merge the files together and then colour them according to what light was used for the this gives us a computational image like this;
Something that was only seen in the red sample would appear very red, something that only appeared in green would appear very green and something in the middle will appear yellow (mixture of green and red)
Computational image analysis needed to extract relative expression values for each gene. Problems include non-specific hybridisation, heterogeneous hybridisation and saturation.
Off-the shelf oligonucleotide array (“gene chips”) are now used more often than spotted microarray slides. Concepts are similar. The above explanation is what you would have done a few years ago in the lab – but now it easier as technologies made it a lot more commercialized.
Very well established kind of way of doing this kind of work
Transcriptomic data analysis
Identifying differentially expressed genes;
Computational analysis is used to work out average colour, so then we can collect all the genes and there expression and compare between one sample and another.
Then typically what we do is plot a scatter graph, used to look at the differential expression of genes between two samples – this is a very commonly used method in transcriptomic data analysis
The idea here is that we have analysed the two samples, and we plot the expression level in the healthy sample X disease sample
For every single gene in the human genome – each spot is an individual gene (20,000) in each plot and anything that doesn’t really differ will be along the diagonal line –
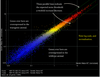
A point in the scatter plot represents each gene on the array. The position of
each point is determined by the expression level of that gene in each sample.
Transcriptomic data analysis software will produce a list of the gene that a difference of expression above a specified threshold. These can be looked up in databases to find biological context.
Volcano plots provide similar information, for experiments where there are enough samples to do significance tests. (more like proper stats)
Each gene is plotted according to its fold change (x axis) and statistical significance (p-value, on the y axis).
So far, our focus has been on identifying individual differentially expressed genes. When we want to get a feel for how expression varies among a number of samples across a large number of genes, we use heatmaps and dendrograms.
In this data from non-Hodgkin’s lymphoma cells, ~17,000 genes are arranged vertically according to their types and ~100 samples arranged horizontally according to similarity of gene expression. They have reorganized them so that samples that are similar are closer together and they added tree diagram (this will be discussed next week)

RNA-Seq
Microarrays are a mature and useful technology, but they are fundamentally limited to monitoring the genes for which probes are present on the array.
This is sufficient for most experiments dealing with model organisms such as human, BUT it does limit the number of variants of each gene (e.g alleles, splice isoforms) that can be monitored.
Most seriously, microarrays are not applicable to the study of organisms for which there is no annotated genome, or with complex samples containing mRNA from multiple species (e.g humans infected with viruses)
RNA sequencing “RNA-seq” provides an alternative method, with which ALL mRNA can be detected and quantified.
There are several different ways to do this. The most obvious is to use reverse transcriptase to generate cDNA from the RNA, the sequence that cDNA.
With an annotated reference genome
Hundreds of millions of short reads are produced, which can be mapped to transcripts annotated on the reference genome. The number of reads that map to a particular gene transcript is proportional to the amount of mRNA from that gene, so can be used to calculate the gene’s expression level. Unlinke florescence-based methods, RNA-seq quantitation scales linearly even to extreme values.
Because it is an open technique, RNA-seq can also reveal presence and quantities of spice variants.
[Image]
Software for mapping reads to reference genomes is complicated because many short reads can map to more than one transcript – there are various ways of dealing with these so-called ambiguous reads.

With no reference genome

RNA-seq can be used in the absence of any kind of reference genome. In this case, transcripts are assembled “de novo” by assembling the short reads. Whilst this does not provide so much information about gene structure, it is the only way to identify and quantify transcription in non-model systems.
When using an unannotated references genomes, transcripts will identifiable only as sequences. Homology searches like BLAST are used to infer transcript function by comparing with other species.