Chap. 1, physics and physical measurement Flashcards
1.1.1 State and compare quantities to the nearest order of magnitude.
Definition of magnitude:
The size of a number rounded to the nearest power of ten.
For example, if we take 400, it’s order of magnitude is 102 , which when we calculate it gives 10 x 10 = 100. This is four times less than the actual value, but that does not matter. The point of orders of magnitude is to get a sense of the scale of the number, in this case we know the number is within the 100s.
1.1.2 State the ranges of magnitude of distances, masses and times that occur in the universe, from smallest to greatest.
Distances:
Sub-nuclear particles: 10-15 m
Extent of the visible universe: 1025 m
Masses:
Mass of electron: 10-30 kg
Mass of universe: 1050 kg
Times:
Passage of light across a nucleus: 10-23s
Age of the universe : 1018s
Radius:
Proton: 10-15m
atom: 10-10m
1.1.3 State ratios of quantities as different orders of magnitude
Using orders of magnitude makes it easy to compare quantities, for example, if we want to compare the size of an an atom (10-10 m) to the size of a single proton (10-15 m) we would take the difference between them to obtain the ratio. Here, the difference is of magnitude 105meaning that an atom is 105 or 100000 times bigger than a proton.
10-10m/10-15m = 105
This has a difference of 5 orders of magnitude.
1.1.4 Estimate approximate values of everyday quantities to one or two significant figures and/or to the nearest order of magnitude.
If you’ve forgoten how to do this, suckass, and read 1.1.4: http://ibguides.com/physics/notes/realm-of-physics
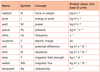
1.2.1 State the fundamental units in the SI system.

1.2.2 Distinguish between fundamental and derived units and give examples of derived units.
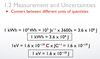
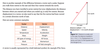
1.2.3 Convert between different units of quantities.
See 1.2.1 and 1.2.2
For example, see the picture below
1.2.4 State units in the accepted SI format.

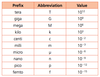
1.2.5 State values in scientific notation and in multiples of units with appropriate prefixes.
This is in the data booklet suckass
1.2.6 Describe and give examples of random and systematic errors.
RANDOM ERROR: When repeated readings give slightly different values, some higher, some lower than the true value. They stem from:
- The observer being less than perfect
- The readability of the equipment
- External effects on the observed item
SYSTEMATIC ERROR: When the measurement is repeatedly incorrect due to a fault in the apparatus or method. They stem from:
- The observer being less than perfect in the same way every time
- An instrument with a zero offset error
- An instrument that is improperly calibrated
1.2.7 Distinguish between precision and accuracy.
Zero error:
A common example of a systemic error. Zero errors are caused by instruments giving readings when no quantity is present. E.g. A balance which has not been zeroed may give a reading when unladen.
Precision:
Measurements are precise if they are closely clustered (small spread): i.e. the uncertainty is small. A measurement is said to be accurate if it has little systematic errors.
Accuracy:
Measurements are accurate if their average is close to the true value: i.e. the systematic error is small. A measurement is said to be precise if it has little random errors.

1.2.8 Explain how the effects of random errors may be reduced.
The effect of random errors on a set of data can be reduced by repeating readings. On the other hand, because systematic errors occur at each reading, repeating readings does not reduce their affect on the data.
1.2.9 Calculate quantities and results of calculations to the appropriate number of significant figures.
Only a simple rule is required: for multiplication and division, the number of significant digits in a result should not exceed that of the least precise value upon which it depends.
The number of significant figures in any answer should reflect the number of significant figures in the given data.
For example:
5.56 * 2.5643 = 14.13
Only 2 sig. figs in the answer, because 5.56 has the least amount of sig figs
1.2.10 State uncertainties as absolute, fractional and percentage uncertainties.
Absolute uncertainties
When marking the absolute uncertainty in a piece of data, we simply add ± 1 of the smallest significant figure.
Example:
13.21 m ± 0.01
0.002 g ± 0.001
1.2 s ± 0.1
12 V ± 1
Fractional uncertainties
To calculate the fractional uncertainty of a piece of data we simply divide the uncertainty by the value of the data.
Example:
1.2 s ± 0.1
Fractional uncertainty:
0.1 / 1.2 = 0.0625
Percentage uncertainties
To calculate the percentage uncertainty of a piece of data we simply multiply the fractional uncertainty by 100.
Example:
1.2 s ± 0.1
Percentage uncertainty:
0.1 / 1.2 x 100 = 6.25 %
1.2.11 Determine the uncertainties in results.

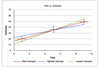
- 2.12 Identify uncertainties as error bars in graphs.
- 2.13 State random uncertainty as an uncertainty range (±) and represent it graphically as an “error bar”.
Error bars are lines drawn through a point on a graph to show the size of the uncertainty. When representing data as a graph, we represent uncertainty in the data points by adding error bars. We can see the uncertainty range by checking the length of the error bars in each direction. Error bars will not be expected for trigonometric or logarithmic functions.
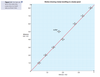
1.2.14 Determine the uncertainties in the gradient and intercepts of a straight- line graph.
Only a simple approach is needed. To determine the uncertainty in the gradient and intercept, error bars need only be added to the first and the last data points.
1.3.1 Distinguish between vector and scalar quantities, and give examples of each.
A vector is represented in print by a bold italicized symbol, for example, F.
- Scalar quantities - have magnaitude (numerical value) and unit. For example, mass= 25k
- Vector quantities - have magnitude (numerical value), direction (plus/minus) and unit. For example, force = 55 and due east
1.3.2 Determine the sum or difference of two vectors by a graphical method.
Multiplication and division of vectors by scalars is also required.
When vectors are parallel
- Summing vectors: Vectors are added
- Finding the difference: The smallest vector is subtracted from the largest
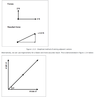
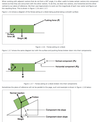
When vectors are not parallel
if they are not parallel, the easiest way to determine the resultant is by the parallelogram law. This says that the resultant of two vectors acting at the point is givin by the diagonal of the parallelogram they form (see picture)
In picture one, you use Pythagoras’ theory. In picture two, you use SOH, CAH, TOA, to find the answer
Scalar multiplication
We can also multiply (and divide) vectors by scalars. When doing so we follow a set of rules:
- Multiplying by 1 does not change a vector 1 v = v
- Multiplying by 0 gives the null vector 0 v = 0
- Multiplying by -1 gives the additive inverse -1 v = -v
- Left distributivity: (c + d)v = cv + dv
- Right distributivity: c(v + w) = cv + cw
- Associativity: (cd)v = c(dv
1.3.3 Resolve vectors into perpendicular components along chosen axes.
These are the estimates you should friggin ass know