Quantitative method Flashcards
Explain what goodness of fit indicates
It is a measure of judging how good our model is by seeing how much actual variance the DV explains. We can use “r-square” as a measure
Elaborate on the principles of EFA
Used for creating scales
- EFA is a technique we use in order to be able to create new constructs so we can use them in research as either DV or IV.
- Important that you decide what kind of scale you are dealing with (Reflective, Aggregate & Profile)
Explain F-value/ F-test
The f-test compares your model with zero predictor variables and decides whether the added coefficients improved the model - if significant then the coefficients included improved the model’s fit
When do you use rotations, what kind of rotations are there, and when do we use which?
Rotations, in general, is used to tweek or data so it gives us a better result and also better interpretations
- *Oblique**
- Often used in reflective/ latent scales
- We allow of covariance among our factors as they are in a lower dimension
- This rotation kind of collapse so it fits the data better. This will result in higher factor loadings
- *Orthogonal**
- Used in aggregate scales when we want our factors to be independent of each other.
- Turns 90 degrees
Please explain the logic behind P-value and confidence intervals
P-value and confidence interval:
We seek to examine the relationship between variables which the p-value that illustrates this objectively. If the p-value is less than 0,05 (with a 95% confidence interval) then the null hypothesis is rejected and the hypothesis is accepted → significance the p-value is more than 0,05 the null hypothesis is accepted and the hypothesis rejected → insignificance.
The confidence interval (CI) is a number between 0 and 1 or is written in percentage, demonstrating the level of confidence the reader can have in the result.
Please explain the different type of variables we have when we do quantitative analysis
Types of Variables
Categorical: variables that are helpful to distinguish between different groups or categories of objects
- Nominal: numbers like 1,2,3 are representing a certain label/object, thus, they are classifications that describe a group of objects.No overlap between the groups so one object cannot belong to two or more groups.
- Ordinal: have some kind of order - e.g. income level
Continuous: allows decimal numbers
- Ratio: has a meaningful distance but also a meaningful null-point
- Interval: allows to calculate distance and actually have a meaning - e.g. the difference between 0-50 degrees which is the same as the distance from 50-100 degrees. However, we have an arbitrary null point - E.g. Celsius
Please outline the characteristics of a Formative/Aggregate scale in EFA
Formative / aggregate (Factors are independent of each other, so we assume a low correlation among the factors. We want to have as little overlap between the factors as possible. We add their total variance together tounderstand our construct = We can’t make an average as we can do in the latent model)
- The main construct is formed from its sub-dimensions
- The main construct does not exist separatelyon a deeper level
- Each dimension can weigh in on the entireconstruct differently or equally, but taking one away would severely impact themeaning of the overall construct (that is the totality of all thesubdimensions)
- We do not expect a person that scores high on the overall construct to score necessarily high on each sub-dimension
Example: friendship (construct) is an abstract thingbut we look at things that can measure a friendship such as A) no. of cinemavisits, B) no. of dinner dates and C) no. of phone calls. Together this itemscan help assess the friendship strength but it is not necessary for all three items to be high in order to have a high level of friendship.
- We are looking at ‘what is causing a strongerfriendship’ and different combinations of the items can give the same level offriendship.
- Friendship = A + B + C. We will find thecombination of items that explain a sufficient amount of construct variance.
- Use varimax rotation - Orthogonal rotation - fixed rotation where there is a constant 90 degrees ankle between theaxis
- Are you planning to make aggregate measure andyou want to make sure the dimension overlap as little as possible? Then you should go for orthogonal rotation.
Please outline the characteristics of a Reflective/ latent scale in EFA
Reflective/latent: Factors are related and have shared variance + We add them all together and can make a sum scale – Simply multiply all the factors and divide by the number of factors = Average score (continuous variable))
- We are usually dealing with human opinions and perceptions, which are almost by definition latent/reflective
Factor analysis is serving us to create scales, so we want some theoretically meaningful structure to emerge from the analysis, especially when we are dealing with reflective scales (which we often do). We know our questions are not going to be perfect, they are only reflecting (imperfectly) some underlying phenomenon that we are actually are trying to measure.
- The main construct exists at a deeper level than the sub-constructs=dimensions
- Higher-order abstraction- commonality among the dimensions
- The sub-dimensions are reflected in the items, the main construct is reflected in the subdimensions
Example: we are not trying to assess the level of friendship from different indicators - we are looking at friendship as a deeper level construct that is not really observable → we look at the symptoms - e.g if a strengthen in a friendship that gives a feeling of warmth and trust○
- *Key differences from formative:** the other the way around compared to formative → a strong friendship would be reflected in some observable symptoms → feeling of warmth and trust. There is a change in unison as if friendship would increase the feeling of trust it would also increase the feeling of warmth → they have a common and shared variance with each other and are not independent.
- Change of unison – Informative/aggregate you could have different combinations and still land at the same level of friendship
Reflective uses oblique rotation - Pattern matric. Are all the items supposed to be part of the same reflective scale that has multiple dimensions? In that case, you expect the dimensions to be correlated and therefore should use oblique rotations.
Tobias report: “Important to be successful and others recognize your achievements” - Reflective = if you score high in that overall construct - Then it will be reflected in all the other factors/sub-behaviours. So if a person scores high on one dimension the most likely also score high on the others as they move up and down together as they are related. These factors could then be summarized in an overall construct as mentioned in the beginning. Therefore we can create an average of them that then captures the overall construct.
Please outline the characteristics of a Profile scale in EFA
Profile: different from the two others
- Dimensions are at the same level as the construct but the constructs cannot be expressed as a function of these dimensions
- Researchers, therefore, create profiles that have some specific levels of the dimensions
- Theoretical reason for combinations
- We cannot really say what better or worse but the profile scale can keep the dependent variable categories apart
Example:
- Matrix of four different options: two independent variables (binary; ham and cheese) where each has binary options(yes/no).
The dependent variables are four possible categories: 1)ham-n-cheese, 2) ham, 3) cheese, 4) bread
- The profile scale has a function to predict the dependent variable based on the independent variables.
Example: Big Five - personality traits. Together, the 5dimensions can help to sort an individual into one of the multiple personalities types (e.g. low on 1-3, high on 4-5 is one distinct DV category).
With a continuous DV there are different kinds of tests - These are often done when doing experiments (Control vs. treatment). Please elaborate on these tests and their differences.
The T-test (2 groups – judge if these groups are different): we have one independent variable that is binary. We can judge if two groups or samples are different and when we only have two groups we can judge it based on the mean.
- If the independent variable data is collected from the same sample = paired sample t-test (within design) and if it is from two different random samples = independent t-test (between design)
- From the mean between the two groups we would like to see if the means are significantly different from each other.
- *ANOVA:** usually used for experiments (multiple groups): would (like any other test) help test whether the model is good and is more or less the same as the t-test but we can have one or more IV’s which must be categorical. DV is a continuous variable.
- One IV that is categorical = one way ANOVA
- More than one IV that is categorical = N-way ANOVA
- In experiments, we would see that we have a control group and a treatment group - E.g. one group use a different way of studying and then we compare the test scores to see if they are significantly different. It is therefore testing the differences in the variance between the groups. We use F-test which provides us with a mean square value for those groups and some degrees of freedom. By dividing the ‘between groups’ mean square with the ‘within groups’ value we get the F-ratio where we can see the significance(When holding it against the confidence level - Often 95%)
Example: IV is a categorical grouping variable and a DV that is a continuous variable (test score). DV → test score of a student,treatment/categorical: 1 = no studying & lectures, 2 = just studying &no lectures, 3 = studying & lectures. Hypothesis testing: H0: all means are the same, H1: at least one is different. Tested with the F-statistics.
Elaborate on the principles of CFA
CFA is for validation
CFA = Helps us to evaluate the quality of the scales and the goodness of our model
- CFA analyses require the researcher to hypothesize, in advance, the number of factors, whether or not these factors are correlated, and which items/measures load and reflect which factors
- while in EFA, the researcher is not required to have any specific hypotheses about how many factors will emerge, and what items or variables these factors will comprise.
What can we use it for?
- We can test whether an already discovered scale works on their data - Use CFA to do that - See if they find similar structures on now different datasets, with different contexts.
What estimation method does linear regression use?
-
Ordinary least squares (OLS) and how to assess the model: method of fitting our regression slope where we estimate the betas so the “sum of squared residuals” (SSR) are minimized. So our error term is as low as possible
- Residuals are the values between the predicted line and the observed values - we want residuals as small as possible as it indicates that the model represents the data well = a good fit. If the SSR value is large, then our model does not really represent the data that well.
-
SST = Reference slope the program use an empty model with no IV’s which means that we use the intercept to predict
- SST = Total variance of the dependent variable
-
SSM = SST - SSR → is our model better than just assuming the DV mean (SST is the simple model = difference between observed data and mean value of the DV)
- SSE = Total variance explained due to our model
- SSR = Leftover variance that is unexplained
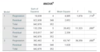
What can we see by looking at the model summary when we are running a linear regression?
Model summary
-
R^2 (R square) = Goodness of fit = SSM / SST → Looking at the overall quality of the model - How much DV variance is explained by our models’ independent variables → R^2 is used as a goodness of fit measure. It is a percentage between 0 and 100%
- Small catch: Because it is calculated as it, our R^2 tend to increase every time we add an IV more - Therefore we need to calculate the adj. R^2
-
Adjusted R^2 b = Penalizes for each IV added to the model - This is used to explain the actual difference between the blocks/models
- Like R^2 it judges the overall quality of our model
- Tells us whether variables added last increase the explanatory power of the model
- Better than normal R^2 as it penalizes the model when one more IV is added
- Tells us how much variance is explained by our model
- Durbin-watson: A measurements that indicate if we have problems with correlated residuals = Less than 1,5 and higher than 2,5 - Will indicate problems

What do we use the ANOVA table for in linear regression?
ANOVA table:
- Shows, if the estimated regression function is significant = Does one of the IV’s have a significant influence on the DV
- F-test = indicator of how much the model has improved the prediction (increase in explained variance) of the outcome in comparison to the level of inaccuracy in the empty model → if the new model is better at explaining the variance compared to a model without IV’s
What is the main difference between linear regression and logistic regression?
Main difference between logistic regression and linear regression:
- Logistic regression allows us to use categorical and discrete variables as our dependent variable. - Opposite to linear regression models which will use a continuous variable as DV
Types of logistic regression:
-
Binary logistic regression: the dependent variable can only take two values - usually 0 and 1. The 0 and 1 (e.g. yes/no) are mutually exclusive and one of them must occur.
- We can’t read our results in the same way → don’t have continuous dependent variable but a discrete variable - we use odds ratio.
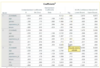
What can you see in a coefficient table in a linear regression model - and how do we interpret this?
Assessing a single predictor in the model: making a hypothesis about the IVs which is tested using t-statistics → if the beta for the IV is significantly different from zero (P-value below 0,05) then the IV has a significant contribution to the DV and should be in the regression.
Unstandardized beta coefficients (Raw data)
- Raw coefficients - 1 point increase in overqualification increases intentions to leave by 0,471 points on a 7-point Likert scale
- Problem with this is that you can’t really compare the IV’s to each other if they are not measured at the same scale. You can only do that if you have standardized coefficients (More on that below)
Standardization of coefficient: Means that we subtract the mean and divide it by standard deviation (SPPS does this for us)
- We do this if we want to compare the coefficients to each other.
- Interpretation: 1 unit increase in the standard deviation of “xx” IV will increase the XX in standard deviation
- Can compare the effect IV’s to each other when it is standardized = We can see which one have the largest effect
- Example on how to write up the model with standardized coefficients
- Interpretation: 1 increase in the std. deviation in OQ will lead to an 0.18 increase in std. deviation in intention to leave. The more overqualified people feel the higher are their intentions to leave
Confidence interval
- Puts the coefficient into perspective - Calculated as +/- 1,96 * standard error = Upper and lower boundary around of coefficient
.
Tell me about logistic regression
Binary logistic regression term
- Linear regression: Has a linear relationship and a continues DV, so we could say that one unit increase in IV x, increase Y by beta 1.
Y=B_0+B_1*X_1+B_k*X_K+error term
-
Logistic regression We do not have the same linear relationship and our DV is not continuous but discreet
- Rather we now have it in the logarithmical form. The DV is binary that varies between 0 and 1 - In order to calculate the beta coefficients, the DV becomes logit - the natural log of the probability = Log of the expected value of epsilon divided by 1 minus the expected value of epsilon.
ln((E(Y)/1-E(Y))=B_0…
An increase in logit doesn’t really make sense and is difficult to draw - Therefore, this formula can be transformed into a probability form which where the value of P(Y) can we plot in a graph very easily. It becomes this sigmoid curve - See how variable IV X has an influence on the probability of Y.
