Aggregrate Supply/Demand Flashcards
(23 cards)
What is Aggregate Demand?
total spending on all goods and services at a period of time at a given price level
What are the determinints of AD?
C + I + G + (X-M)
What does AD show?
relationship between GDP level (output demanded) and economy’s price level
What are causes of changes in consumption spending
- changes in consumer confidence
- changes in interest rates
- changes in wealth
- changes in income taxes (tax more, disposable income decrease, spending decrease)
- change in household indebtness (more debt, less spending) - expectations of future price level
What are examples of Consumption (C)?
spending on (non) durable goods/services
What are examples of Investment (I)?
additional capital stocks to the economy, increasing output due to increase in demand
What are examples of Government spending (G)?
healthcare, transfortation, education, housing….
What are Exports (X)?
domestic goods/services bought by foreigners
What are Imports (M)?
foreign goods/services bought domestically
Why AD curve downward sloping?
- Real Wealth Effect (price level ↑, wealth/excess money ↓
- Interest Rate Effect (interest rate ↑ by more demand of money, borrowing ↓)
- Exchange Rate Effect (domestic price↑ domestic good more expensive, less net export)
Can national income cause AD shifts?
No
What is short run?
when price level changes but price of FOP’s (resources) DON’T
What is long run?
when price of FOP’s (resources) CHANGE WITH price level
Why don’t wages (price of labor) change with price level in short periods of time? (sticky wages)
- labor contracts have fix wage rates (2 yr contract at 5/hr) - minimum wage legislation fix to LOWEST LEGALLY possible wage - labor unions/workers REFUSE WAGE CUTS - wage cuts negative effect motivation so firms avoid them
What does short/long run affect?
AGGREGATE SUPPLY! not AD
What is Aggregate Supply (AS)?
totaly QUANTITY of goods/services produced (real GDP) over time period at diff price levels (price level vs real GDP)
What does SRAS show?
the relationship between price levels and quantity of real output (real GDP) when FOP prices DON’T CHANGE
What causes shifts in the SRAS curve? shift where?
shift in SUPPLY SHOCKS (shift left), SUBSIDIES (shift right)
Why is SRAS curve upward sloping?
*positive relationship between price level & real GDP*
- price level↑, output price↑, in short run so FOP price same so price level change profit ↑. more profitable so product more (higher GDP)
- price level ↓, output price ↓, FOP price same cause short run so profit ↓. less profitable so product less (lower GDP)
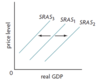
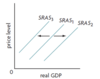
What causes SRAS curve to shift?
- changes in wages (if wage ↑ with non-changing price level, then costs of production ↑, SRAS shift left) vise versa
- changes in indirect taxes (↓ indirect tax ↓ production costs so can produce more, SRAS shift right) vise versa
- supply shocks (SUDDEN EVENTS that effect SRAS) (if suddenly war, economy disrupted, ↓ outputs produced and ↓ spending, SRAS shift left) vise versa
- changes in subsidies offered to businesses (subsidies ↑ production costs↓ so can produce more, SRAS shift right) vise versa
How to shift AD curve in SR?
↑ AD (↑investment, spending etc) , AD shift right, price and GDP ↑. less unemployment cause firms need to hire more labor to fulfill the ↑ demand
vise versa

make from 9.3
