Cardiac Muscle; The Heart as a Pump and Function of the Heart Valves Flashcards

(101 cards)

1
Q

The
heart is
actually two separate pumps:

A
  • a right heart that pumps blood through the lungs, and
  • a left heart that pumps blood through the peripheral organs
2
Q

Each of these hearts is a pulsatile two-chamber
pump composed of an :

A

atrium and a ventricle

3
Q

What is the funciton of atrium?

A

Each atrium
is a weak primer pump for the ventricle, helping to move
blood into the ventricle.

4
Q

The ventricles then supply the main
pumping force that propels the blood either

A

(1) through the pulmonary circulation by the right ventricle or

(2) through the peripheral circulation
by the left ventricle

5
Q

What is cardiac rhythmicity?

A

Special mechanisms in the heart cause a continuing
succession of heart contractions
called cardiac rhythmicity, transmitting action potentials throughout the cardiac muscle to cause the heart’s rhythmical beat.

This rhythmical
control system is explained in Chapter 10.

In this chapter,
we explain how the heart operates as a pump, beginning with the special features of cardiac muscle itself.

6
Q

The heart is composed of three major types of cardiac muscle:

A
  • atrial muscle,
  • ventricular muscle, and
  • specialized excitatory and conductive muscle fibers.
7
Q

The atrial and ventricular types of muscle contract in much the same way as skeletal muscle, except that the ___________.

A

duration of contraction is much longer

The specialized excitatory and conductive fibers, however, contract only feebly because they contain few contractile fibrils; instead, they exhibit either automatic rhythmical electrical discharge in the form of action potentials or conduction of the action potentials through the heart, providing an excitatory system that controls the rhythmical beating of the heart.

8
Q

Describe the cardiac muscle as a muscle.

A

cardiac muscle is striated in the same manner as in skeletal muscle.

Further, cardiac muscle has typical myofibrils that contain actin and myosin filaments almost identical to those found in skeletal muscle; these filaments lie side by side and slide along one another during contraction in the same manner as occurs in skeletal muscle (see Chapter 6). But in other ways, cardiac muscle is quite different from skeletal muscle, as we shall see.

9
Q

De scribeCardiac Muscle as a Syncytium.

A

The dark areas crossing the cardiac muscle fibers are called intercalated discs; they are actually cell membranes that separate individual cardiac muscle cells from one another. That is, cardiac muscle fibers are made up of many individual cells connected in series and in parallel with one another.

At each intercalated disc the cell membranes fuse with
one another in such a way that they form permeable “communicating”
junctions (gap junctions) that allow rapid
diffusion of ions. Therefore, from a functional point of
view, ions move with ease in the intracellular fluid along action potentials travel easily from one cardiac muscle cell to the next, past the intercalated discs.

Thus, cardiac
muscle is a syncytium of many heart muscle
cells in which the cardiac cells are so interconnected that when one of these cells becomes excited, the action potential spreads to all of them, from cell to cell throughout the latticework
interconnections.
the longitudinal axes of the cardiac muscle fibers so that action potentials travel easily from one cardiac muscle cell to the next, past the intercalated discs.

Thus, cardiac
muscle is a syncytium of many heart muscle cells in which the cardiac cells are so interconnected that when one of these cells becomes excited, the action potential spreads to all of them, from cell to cell throughout the latticework
interconnections.

10
Q

The heart actually is composed of two syncytiums:

A
  • the atrial syncytium, which constitutes the walls of the two atria, and the
  • ventricular syncytium, which constitutes the walls of the two ventricles.
11
Q

How are potentials conducted to the atria?

A

The atria are separated from the ventricles by fibrous tissue that surrounds the atrioventricular (A-V) valvular openings between the atria and ventricles.

Normally, potentials are not conducted from the atrial syncytium into the ventricular syncytium directly through this fibrous tissue.

Instead, they are conducted only by way of a specialized conductive system called the A-V bundle, a bundle of conductive fibers several millimeters in diameter that is discussed in detail in

12
Q

What is the reason for the division of the muscle of the heart into two functional syncytium?

A

This division of the muscle of the heart into two functional
syncytiums allows the atria to contract a short time
ahead of ventricular contraction, which is important for
effectiveness of heart pumping.

13
Q

Action Potentials in Cardiac Muscle

A

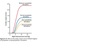
The action potential recorded in a ventricular muscle fiber averages about 105 millivolts, which means that the intracellular potential rises from a very negative value, about −85 millivolts, between beats to a slightly positive value, about +20 millivolts, during each beat.

After the initial spike, the membrane remains depolarized for about 0.2 second, exhibiting a plateau as shown in the figure, followed at the end of the plateau by abrupt repolarization.

The presence of this plateau in the action potential causes ventricular contraction to last as much as 15 times as long in cardiac muscle as in skeletal muscle.

14
Q

What Causes the Long Action Potential and the
Platea?

Why

is the action potential of cardiac muscle so long and

why does it have a plateau, whereas that of skeletal muscle does not?

A

At least two major differences between the membrane
properties of cardiac and skeletal muscle account for the
prolonged action potential and the plateau in cardiac muscle.

  • First, the action potential of skeletal muscle is caused almost entirely by sudden opening of large numbers of socalled fast sodium channels that allow tremendous numbers of sodium ions to enter the skeletal muscle fiber from the extracellular fluid.

These channels are called “fast” channels because they remain open for only a few thousandths of a second and then abruptly close.

At the end of
this closure, repolarization occurs, and the action potential is over within another thousandth of a second or so.

  • The second major functional difference between cardiac muscle and skeletal muscle that helps account for both the prolonged action potential and its plateau is this:

Immediately after the onset of the action potential, the permeability
of the cardiac muscle membrane for potassium
ions decreases about fivefold,
an effect that does not occur in skeletal muscle This decreased potassium permeability may result from the excess calcium
influx through the calcium channels just noted.

Regardless of the cause,
the decreased potassium permeability greatly decreases the outflux of positively charged potassium ions during the action potential plateau and thereby prevents early return of the action potential voltage to its resting level.

When the
slow calcium-sodium channels do close at the end of 0.2 to 0.3 second and the influx of calcium and sodium ions ceases, the membrane permeability for potassium ions also increases rapidly; this rapid loss of potassium from the fiberimmediately returns the membrane potential to its resting level, thus ending the action potential.

15
Q

In cardiac muscle, the action potential is caused by opening of two types of channels:

A
  • (1) the same fast sodium channels as those in skeletal muscle and
    • (2) another entirely different population of slow calcium channels, which are also called calcium-sodium channels.
16
Q

Explain the
different population of slow calcium channels, which are
also called calcium-sodium channels in the cardiac muscle.

A

This second population
of channels differs from the fast sodium channels in
that they are slower to open and, even more important, remain open for several tenths of a second.

During this
time, a large quantity of both calcium and sodium ions
flows through these channels to the interior of the cardiac muscle fiber, and this maintains a prolonged period of depolarization, causing the plateau in the action potential.

Further, the calcium ions that enter during this plateau phase activate the muscle contractile process, while the calcium ions that cause skeletal muscle contraction are
derived from the intracellular sarcoplasmic
reticulum.

17
Q

The second major functional difference between cardiac
muscle and skeletal muscle that helps account for
both the prolonged action potential and its plateau is this:

A

Immediately after the onset of the action potential, the permeability of the cardiac muscle membrane for potassium ions decreases about fivefold, an effect that does not occur in skeletal muscle.

18
Q

The second major functional difference between cardiac
muscle and skeletal muscle that helps account for
both the prolonged action potential and its plateau is this:

Explain the reason for decreased potassium permeability

A

This decreased potassium permeability
may result from the excess calcium
influx
through the calcium channels just noted.

Regardless of the cause,
the decreased potassium permeability greatly decreases the outflux of positively charged potassium ions during the action potential plateau and thereby prevents early return
of the action potential voltage to its resting level.

When the slow calcium-sodium channels do close at the end of 0.2 to 0.3 second and the influx of calcium and sodium ions ceases, the membrane permeability for potassium ions also increases rapidly; this rapid loss of potassium from the fiber
immediately returns the membrane potential
to its resting level, thus ending the action potential.

19
Q

Velocity of Signal Conduction in Cardiac Muscle

A

The velocity of conduction of the excitatory action potential signal along both atrial and ventricular muscle fibers is about 0.3 to 0.5 m/sec, or about 1⁄250 the velocity in very large nerve fibers and about 1⁄10 the velocity in skeletal muscle fibers.

The velocity of conduction in the specialized heart conductive system—in the Purkinje fibers—is as great as 4 m/sec in most parts of the system, which allows reasonably rapid conduction of the excitatory signal to the different parts of the heart, as explained in Chapter 10.

20
Q

Explain the Refractory Period of Cardiac Muscle.

A

Cardiac muscle, like all excitable tissue, is refractory to restimulation during the action potential.

Therefore, the refractory period of the
heart is the interval of time
, during which anormal cardiac impulse cannot reexcite
an already excited area of cardiac muscle

21
Q

What is the normal refractory pd of the ventricle?

A

The normal
refractory period of the ventricle is 0.25 to 0.30 second,
which is about the duration of the prolonged plateau action potential.

22
Q

Describe the early “ premature” contraction.

A

There is an additional relative refractory period of about 0.05 second during which the muscle is more difficult than normal to excite but nevertheless can be excited by a very strong excitatory signal, as demonstrated by the early “premature” contraction in the second example of Figure 9-4.

23
Q

What is the refactory period of the atrial muscle?

A

The refractory period of atrial muscle is much shorter than that for the ventricles (about 0.15 second for the atria compared with 0.25 to 0.30 second for the ventricles).

24
Q

What is “excitation-contraction coupling?

A

The term “excitation-contraction coupling” refers to the
mechanism by which the action potential causes the
myofibrils of muscle to contract
. T

his was discussed for
skeletal muscle in Chapter 7. Once again, there are differences in this mechanism in cardiac muscle that have
important effects on the characteristics of heart muscle
contraction

25
As is true for skeletal muscle, when an action potential passes over the cardiac muscle membrane, the action potential spreads to the interior of the cardiac muscle fiber along the membranes of the transverse (T) tubules. The T tubule action potentials in turn act on the membranes of the longitudinal sarcoplasmic tubules to cause release of calcium ions into the muscle sarcoplasm from the sarcoplasmic reticulum. In another few thousandths of a second, these calcium ions diffuse into the myofibrils and catalyze the chemical reactions that promote sliding of the actin and myosin filaments along one another; this produces the muscle contraction. Thus far, this mechanism of excitation-contraction coupling is the same as that for skeletal muscle, but **there is a second effect that is quite different which is:**
In addition to the calcium ions that are released into the sarcoplasm from the cisternae of the sarcoplasmic reticulum, **calcium ions also diffuse into the sarcoplasm from the T tubules themselves at the time of the action potential, *which opens voltage-dependent calcium channels in the membrane of the T tubule*** (Figure 9-5). Calcium entering the cell then activates calcium release channels, also called **ryanodine receptor** channels, in the sarcoplasmic reticulum membrane, **triggering the release of calcium into the sarcoplasm.** Calcium ions in the sarcoplasm then interact with troponin to initiate cross-bridge formation and contraction by the same basic mechanism as described for skeletal muscle in Chapter 6.
26
Without the calcium from the T tubules, the **strength of cardiac muscle contraction would be reduced considerably why**?
because the **sarcoplasmic reticulum of cardiac muscle is less well developed** than that of skeletal muscle and **does not store enough calcium to provide full contraction**. The **T tubules of cardiac muscle**, however, have a diameter **5 times as great as that of the skeletal** muscle tubules, w**hich means a volume 25 times as great.** Also, inside the T tubules is a **large quantity of mucopolysaccharides that are electronegatively charged and bind an abundant store of calcium ions, *keeping these always available for diffusion to the interior of the cardiac muscle fiber when a T tubule action potential appears***
27
The strength of contraction of cardiac muscle depends to a **great extent on the\_\_\_\_\_\_\_\_\_\_\_\_\_\_.**
**concentration of calcium ions** in the **extracellular fluids.** In fact, a heart placed in a calcium- free solution will quickly stop beating. The reason for this is that the **openings of the T tubules pass directly through the cardiac muscle cell membrane into the extracellular spaces surrounding the cells, allowing the same extracellular fluid that is in the cardiac muscle interstitium to percolate through the T tubules as well.** **Consequently, the quantity of calcium ions in the T tubule system (i.e., the availability of calcium ions to cause cardiac muscle contraction) depends to a great extent on the extracellular fluid calcium ion concentration.**
28
In comparison to skeletal muscle, is it affected by moderate changes in the extracellular fluid calcium concentration?
In contrast, the strength of skeletal muscle contraction is hardly affected by moderate changes in extracellular fluid calcium concentration **because skeletal** **muscle contraction is caused almost entirely by calcium ions released from the sarcoplasmic reticulum inside the skeletal muscle fiber.**
29
At the end of the plateau of the cardiac action potential, what happens?
the **influx of calcium ions to the interior of the muscle** **fiber is suddenly cut off**, and the calcium ions in the sarcoplasm are rapidly pumped back out of the muscle fibers into both the sarcoplasmic reticulum and the T tubule– extracellular fluid space. Transport of calcium back into the sarcoplasmic reticulum is achieved with the **help of a** **calcium-ATPase pump** (see Figure 9-5). Calcium ions are also removed from the cell by a **sodium-calcium exchanger.** The sodium that enters the cell during this exchange is then transported out of the cell by the sodium-potassium ATPase pump. As a result, the contraction ceases until a new action potential comes along.
30
Duration of Contraction.
Cardiac muscle begins to contract a few milliseconds after the action potential begins and continues to contract until a few milliseconds after the action potential ends. Therefore, the **duration of contraction of cardiac muscle is mainly a function of the duration of the action potential, including the plateau**— about**0.2 second in atrial muscle and 0.3 second in ventricular muscle**
31
What is a cardiac cycle?
The cardiac events that occur from the beginning of one heartbeat to the beginning of the next are called the cardiac cycle.
32
How is the cardiac cycle initiated?
Each cycle is **initiated by spontaneous generation** of an **action potential in the sinus node,** as explained in Chapter 10. This node is located in the **superior lateral wall of the right atrium near the opening of the superior vena** cava, and the **action potential travels from here rapidly through both atria and then through the A-V bundle into the ventricles.** Because of this special arrangement of the conducting system from the atria into the ventricles, there is a delay of more than 0.1 second during passage of the cardiac impulse from the atria into the ventricles. This **allows the atria to contract ahead of ventricular** contraction, **thereby pumping blood into the ventricles before the strong ventricular contraction begins.** Thus, the **atria act as primer pumps for the ventricles,** and the **ventricles in turn provide the major source of power for moving blood through the body’s vascular system.**
33
What is a diastole?
The **cardiac cycle consists of a period of relaxation** called diastole, during which the **heart fills with blood.**
34
What is a systole?
a period of contraction that follows diastole
35
Describe the total duration of the cardiac cycle.
The total duration of the cardiac cycle, **including systole** **and diastole**, is the reciprocal of the heart rate. For example, if heart rate is **72 beats/min**, the duration of the cardiac cycle is 1/72 beats/min—about 0.0139 minutes per beat, or 0.833 second per beat
36
Figure 9-6 shows the different events during the cardiac cycle for the left side of the heart. The top three curves show the pressure changes in the aorta, left ventricle, and left atrium, respectively. The fourth curve depicts the changes in left ventricular volume, the fifth the electrocardiogram, and the sixth a phonocardiogram, which is a recording of the sounds produced by the heart—mainly by the heart valves—as it pumps. It is especially important that the reader study in detail this figure and understand the causes of all the events shown.
37
Effect of Heart Rate on Duration of Cardiac Cycle.
When **heart rate increases**, the **duration of each cardiac cycle decreases,**including the**contraction and relaxation phases.** The **duration of the action potential** and the **period of contraction (systole) also decrease**, but not by as great a percentage as does the relaxation phase (diastole). At a normal heart rate of 72 beats/min, systole comprises about 0.4 of the entire cardiac cycle. At three times the normal heart rate, systole is about 0.65 of the entire cardiac cycle. This means that the heart beating at a very fast rate does not remain relaxed long enough to allow complete filling of the cardiac chambers before the next contraction.
38
Relationship of the Electrocardiogram to the Cardiac Cycle What is the P wave?
The P wave is caused by **spread of depolarization** **through the atria**, and this is followed by atrial contraction, which causes a slight rise in the atrial pressure curve immediately after the electrocardiographic P wave.
39
What is QRS wave?
About 0.16 second after the onset of the P wave, the * *QRS waves appear as a result of electrical depolarizatio**n **of the ventricles,** which **initiates contraction of the ventricles** and **causes the ventricular pressure to begin rising,**as also shown in the figure. Therefore, the QRS complex * *begins slightly before the onset of ventricular systole.**
40
What is the T wave?
Finally, one observes the ventricular T wave in the electrocardiogram. This **represents the stage of repolarization** **of the ventricles when the ventricular muscle fibers begin to relax**. Therefore, the T wave occurs slightly before the end of ventricular contraction.
41
Function of the Atria as Primer Pumps
Blood normally flows continually from the great veins into the atria; about 80 percent of the blood flows directly through the atria into the ventricles even before the atria contract. Then, a**trial contraction usually causes an additional 20 percent filling of the ventricles**. Therefore, the atria **simply function as primer pumps that increase the ventricular pumping effectiveness as much as 20 percent.**
42
What is the reason when atria fail to function, the difference is unlikely to be noticed unless a person exercises?
However, the **heart can continue to operate under mostconditions even without this extra 20 percent** effectiveness **because it normally has the capability of pumping 300 to 400 percent more blood than is required by the resting body.** Therefore, when the atria fail to function, the difference is unlikely to be noticed unless a person exercises; then acute signs of heart failure occasionally develop, especially shortness of breath
43
Pressure Changes in the Atria—a, c, and v Waves
In the atrial pressure curve of Figure 9-6, three minor pressure elevations, called the a, c, and v atrial pressure waves, are noted.
44
What is a wave?
The **a wave is caused by atrial contraction**. Ordinarily, the right atrial pressure increases 4 to 6 mm Hg during atrial ontraction, and the left atrial pressure increases about 7 to 8 mm Hg
45
What is the c wave?
The c wave occurs **when the ventricles begin to contract; it is caused partly by slight backflow of blood into the atria** at the onset of ventricular contraction but mainly by bulging of the A-V valves backward toward the atria because of increasing pressure in the ventricles
46
What is the v wave?
The v wave occurs **toward the end of ventricular** contraction; it results from slow flow of blood into the atria from the veins while the A-V valves are closed during ventricular contraction. Then, when ventricular contraction is over, the A-V valves open, allowing this stored atrial blood to flow rapidly into the ventricles and causing the v wave to disappear.
47
Function of the Ventricles as Pumps
Filling of the Ventricles During Diastole
48
What happens during Filling of the Ventricles During Diastole?
During ventricular systole, large amounts of blood accumulate in the right and left atria because of the closed A-V valves. Therefore**, as soon as systole is over and the ventricularpressures fall again to their low diastolic values**, the moderately increased pressures that have developed in the atria during ventricular systole immediately push the A-V valves open and allow blood to flow rapidly into the ventricles, as shown by the rise of the left ventricular volume curve in Figure 9-6. This is called the period of rapid filling of the ventricles The period of rapid filling lasts for about the first third of diastole. During the middle third of diastole, only a small amount of blood normally flows into the ventricles; this is blood that continues to empty into the atria from the veins and passes through the atria directly into the ventricles. During the last third of diastole, the atria contract and give an additional thrust to the inflow of blood into the ventricles; this accounts for about 20 percent of the filling of the ventricles during each heart cycle
49
Emptying of the Ventricles During Systole
* Period of Isovolumic (Isometric) Contraction * Period of Ejection * Period of Isovolumic (Isometric) Relaxation * End-Diastolic Volume, End-Systolic Volume, and Stroke Volume Output
50
Period of Isovolumic (Isometric) Contraction
Immediately after ventricular contraction begins, the **ventricular pressure rises abruptly,** as shown in Figure 9-6, **causing the A-V valves to close.** Then an **additional 0.02 to 0.03 second is required for the ventricle to build up sufficient pressure** to p**ush the semilunar (aortic and pulmonary) valves open** against the pressures in the aorta and pulmonary artery. Therefore, **during this period, contraction is occurring in the ventricles, but there is no emptying**. This is **called the period of isovolumic or isometric**contraction,**meaning that tension is increasing in the muscle but little or no shortening of the muscle fibers is occurring.**
51
Discuss the period of ejection.
Period of Ejection. When the left ventricular pressure rises slightly above 80 mm Hg (and the right ventricular pressure slightly above 8 mm Hg), the ventricular pressures push the semilunar valves open. Immediately, blood begins to pour out of the ventricles, with about 70 percent of the blood emptying occurring during the first third of the period of ejection and the remaining 30 percent emptying during the next two thirds. Therefore, the first third is called the period of rapid ejection, and the last two thirds, the period of slow ejection
52
Discuss the Period of Isovolumic (Isometric) Relaxation.
Period of Isovolumic (Isometric) Relaxation. At the end of systole, ventricular relaxation begins suddenly, allowing both the right and left intraventricular pressures to decrease rapidly. The elevated pressures in the distended large arteries that have just been filled with blood from the contracted ventricles immediately push blood back toward the ventricles, which snaps the aortic and pulmonary valves closed. For another 0.03 to 0.06 second, the ventricular muscle continues to relax, even though the ventricular volume does not change, giving rise to the period of isovolumic or isometric relaxation. During this period, the intraventricular pressures decrease rapidly back to their low diastolic levels. Then the A-V valves open to begin a new cycle of ventricular pumping.
53
Discuss the Period of Isovolumic (Isometric) Relaxation
At the end of systole, ventricular relaxation begins suddenly, allowing both the right and left intraventricular pressures to decrease rapidly. The elevated pressures in the distended large arteries that have just been filled with blood from the contracted ventricles immediately push blood back toward the ventricles, which snaps the aortic and pulmonary valves closed. For another 0.03 to 0.06 second, the ventricular muscle continues to relax, even though the ventricular volume does not change, giving rise to the period of isovolumic or isometric relaxation. During this period, the intraventricular pressures decrease rapidly back to their low diastolic levels. Then the A-V valvesopen to begin a new cycle of ventricular pumping.
54
Discuss the End-Diastolic Volume, End-Systolic Volume, and Stroke Volume Output.
During diastole, normal filling of the ventricles increases the volume of each ventricle to about 110 to 120 ml. This volume is called the end- diastolic volume. Then, as the ventricles empty during systole, the volume decreases about 70 ml, which is called the stroke volume output. The remaining volume in each ventricle, about 40 to 50 ml, is called the end-systolic volume. The fraction of the end-diastolic volume that is ejected is called the ejection fraction—usually equal to about 60 percent. When the heart contracts strongly, the end-systolic volume can be decreased to as little as 10 to 20 ml. Conversely, when large amounts of blood flow into the ventricles duringn diastole, the ventricular end-diastolic volumes can become as great as 150 to 180 ml in the healthy heart. By both increasing the end-diastolic volume and decreasing the end-systolic volume, the stroke volume output can be increased to more than double normal
55
What is the end diastolic volume?
During diastole, normal filling of the ventricles increases the volume of each ventricle to about 110 to 120 ml. This volume is called the end- diastolic volume.
56
What is stroke volume output?
Then, as the ventricles empty during systole, the **volume decreases about 70 ml,** which is called the stroke volume output.
57
What is the end-systolic volume?
The remaining volume in each ventricle, about 40 to 50 ml, is called the end-systolic volume.
58
What is the ejection fraction?
The fraction of the end-diastolic volume that is ejected is called the ejection fraction—usually equal to about 60 percent.
59
When the heart contracts strongly, the end-systolic volume can be decreased to as little as **10 to 20 ml.** Conversely, when large amounts of blood flow into the ventricles during diastole, the ventricular end-diastolic volumes can become as great as 150 to 180 ml in the healthy heart. By both increasing the end-diastolic volume and decreasing the end-systolic volume, the stroke volume output can be increased to more than double normal
60
What is the function of the Atrioventricular Valves?
The A-V valves (the tricuspid and mitral valves) **prevent backflow of blood from the ventricles to the atria during systol**e, and the**semilunar valves (the aortic and pulmonary artery valves) prevent backflow from the aorta**and**pulmonary arteries into the ventricles during diastole.** These valves, shown in Figure 9-7 for the left ventricle, **close and open passively.** That is, **they close when a backward pressure gradient pushes blood backward, and they open when a forward pressure gradient forces blood in the forward direction.** **For anatomical reasons, the thin, filmy A-V valves require almost no backflow to cause closure, whereas the much heavier semilunar valves require rather rapid backflow for a few milliseconds**
61
What is the difference between A-V valves with semilunar valves?
For anatomical reasons, the thin, filmy A-V valves require almost no backflow to cause closure, whereas the much heavier semilunar valves require rather rapid backflow for a few milliseconds
62
What are the function of papillary muscles?
Function of the Papillary Muscles. Figure 9-7 also shows papillary muscles that attach to the vanes of the A-V valves by the chordae tendineae. The **papillary muscles** **contract when the ventricular walls contract,** but contrary to what might be expected, **they do not help the** **valves to close.** **Instead, they pull the vanes of the valves inward toward the ventricles to prevent their bulging too far backward toward the atria during ventricular contraction.** **If a chorda tendinea becomes r**uptured or if one of the papillary muscles becomes paralyzed, the valve bulges far backward during ventricular contraction, sometimes so far that it leaks severely and results in severe or even lethal cardiac incapacity.
63
What are the function of Aortic and Pulmonary Artery Valves?
The aortic and pulmonary artery semilunar valves **function quite differently from the A-V valves.** * First, the **high pressures in the arteries at the end of systole cause the semilunar valves to snap to the closed position**, in contrast to the much softer closure of the A-V valves. * Second, **because of smaller openings**, the **velocity of blood ejection through the aortic and pulmonary valves is far greater than that through the much larger A-V valves.** Also, because of the rapid closure and rapid ejection, the edges of the aortic and pulmonary valves are subjected to much greater mechanical abrasion than are the A-V valves. Finally, the A-V valves are supported by the chordae tendineae, which is not true for the semilunar valves. It is obvious from the anatomy of the aortic and pulmonary valves (as shown for the aortic valve at the bottom of Figure 9-7) that they must be constructed with an especially strong yet very pliable fibrous tissue base to withstand the extra physical stresses.
64
Aortic Pressure Curve
When the left ventricle contracts, the ventricular pressure increases rapidly until the aortic valve opens. Then, after the valve opens, the pressure in the ventricle rises much less rapidly, as shown in Figure 9-6, because blood immediately flows out of the ventricle into the aorta and then into the systemic distribution arteries. The entry of blood into the arteries causes the walls of these arteries to stretch and the pressure to increase to about 120 mm Hg. Next, at the end of systole, after the left ventricle stops ejecting blood and the aortic valve closes, the elastic walls of the arteries maintain a high pressure in the arteries, even during diastole. A so-called incisura occurs in the aortic pressure curve when the aortic valve closes. This is caused by a short period of backward flow of blood immediately before closure of the valve, followed by sudden cessation of the backflow. After the aortic valve has closed, the pressure in the aorta decreases slowly throughout diastole because the blood stored in the distended elastic arteries flows continually through the peripheral vessels back to the veins. Before the ventricle contracts again, the aortic pressure usually has fallen to about 80 mm Hg (diastolic pressure), which is two thirds the maximal pressure of 120 mm Hg (systolic pressure) that occurs in the aorta during ventricular contraction. The pressure curves in the right ventricle and pulmonary artery are similar to those in the aorta, except that the pressures are only about one sixth as great, as discussed in Chapter 14.
65
Relationship of the Heart Sounds to Heart Pumping
When listening to the heart with a stethoscope, one **does not hear the opening of the valves because this is a relatively slow process that normally makes no noise.** However, when the valves close, the vanes of the valves and the surrounding fluids vibrate under the influence of sudden pressure changes, giving off sound that travels in all directions through the chest. **When the ventricles contract,** **one first hears a sound caused by closure of the A-V valves.** The **vibration is low in pitch** and **relatively long-lasting and is known as the first heartn** **sound**. When the **aortic and pulmonary valves close at the end of systole,**one hears a rapid snap because these valves close rapidly, and the surroundings vibrate for a short period. **This sound is called the second heart sound.** The precise causes of the heart sounds are discussed more fully in Chapter 23, in relation to listening to the sounds with the stethoscope.
66
What is the stroke work output of the heart?
The stroke work output of the heart is the **amount of energy** **that the heart converts to work during each heartbeat while pumping blood into the arteries.**
67
What is the Minute work output?
Minute work output is the **total amount of energy converted to work in 1 minute;** this is **equal to the stroke work output times the heart rate per minute.**
68
Work output of the heart is in two forms.
* First, by far the major proportion is used to move the blood from the lowpressure veins to the high-pressure arteries. This is called **volume-pressure work or external work.** * Second, a minor proportion of the energy is used to accelerate the blood to its velocity of ejection through the aortic and pulmonary valves. This is the kinetic energy of blood flow component of the work output.
69
Right ventricular external work output is normally about one sixth the work output of the left ventricle because of the sixfold difference in systolic pressures that the two ventricles pump. The additional work output of each ventricle required to create kinetic energy of blood flow is proportional to the mass of blood ejected times the square of velocity of ejection.
70
Ordinarily, the work output of the left ventricle required to create kinetic energy of blood flow is only about 1 percent of the total work output of the ventricle and therefore is ignored in the calculation of the total stroke work output. But in certain abnormal conditions, such as aortic stenosis, in which blood flows with great velocity through the stenosed valve, more than 50 percent of the total work output may be required to create kinetic energy of blood flow
71
Graphical Analysis of Ventricular Pumping
Figure 9-8 shows a diagram that is especially useful in explaining the pumping mechanics of the left ventricle. The most important components of the diagram are the two curves labeled **“diastolic pressure” and “systolic pressure.**” These curves are volume-pressure curves. The diastolic pressure curve is determined by filling the heart with progressively greater volumes of blood and then measuring the diastolic pressure immediately before ventricular contraction occurs, which is the end-diastolic pressure of the ventricle. The systolic pressure curve is determined by recording the systolic pressure achieved during ventricular contraction at each volume of filling. Until the volume of the noncontracting ventricle rises above about 150 ml, the “diastolic” pressure does not increase greatly. Therefore, up to this volume, blood can flow easily into the ventricle from the atrium. Above 150 ml, the ventricular diastolic pressure increases rapidly, partly because of fibrous tissue in the heart that will stretch no more and partly because the pericardium that surrounds the heart becomes filled nearly to its limit. During ventricular contraction, the “systolic” pressure increases even at low ventricular volumes and reaches a maximum at a ventricular volume of 150 to 170 ml. Then, as the volume increases still further, the systolic pressure actually decreases under some conditions, as demonstrated by the falling systolic pressure curve in Figure 9-8, because at these great volumes, the actin and myosin filaments of the cardiac muscle fibers are pulled apart far enough that the strength of each cardiac fiber contraction becomes less than optimal. Note especially in the figure that the maximum systolic pressure for the normal left ventricle is between 250 and 300 mm Hg, but this varies widely with each person’s heart strength and degree of heart stimulation by cardiac nerves. For the normal right ventricle, the maximum systolic pressure is between 60 and 80 mm Hg
72
Volume-Pressure Diagram” During the Cardiac Cycle; Cardiac Work Output It is divided into four phases
1. Phase I: **Period of filling.** 2. Phase II: **Period of isovolumic contraction** 3. Phase III: **Period of ejection** 4. Phase IV: **Period of isovolumic relaxation.**
73
Describe Phase I: Period of filling.
Phase I: Period of filling. This phase in the volume- pressure diagram **begins at a ventricular volume of about 50 ml**and a**diastolic pressure of 2 to 3 mm Hg.** The **amount of blood that remains in the ventricle after the previous heartbeat, 50 ml, is called the end-systolic volume.** As venous blood flows into the ventricle from the left atrium, the **ventricular volume normally increases to about 120 ml, called the end-diastolic volume, an increase of 70 ml.** Therefore, the volume-pressure diagram during p**hase I extends along the line labeled “I,” from point A to point B, with the volume increasing to 120 ml and the diastolic pressure rising to about 5 to 7 mm Hg.**
74
Describe thePhase II: Period of isovolumic contraction.
Phase II: Period of isovolumic contraction. During isovolumic contraction, **the volume of the ventricle does not change because all valves are closed.** However, the **pressure inside the ventricle increases to equal the pressure in the aorta, at a pressure value of about 80 mm Hg, as depicted by point C.**
75
Describe the Phase III: Period of ejection.
Phase III: Period of ejection. During ejection, the **systolic pressure rises even higher** because of still more contraction of the ventricle. At the same time, the volume of the ventricle decreases because the aortic valve has now opened and blood flows out of the ventricle into the aorta. Therefore, the curve labeled “III,” or “period of ejection,” **traces the changes in volume and systolic pressure during this period of ejection.**
76
Describe Phase IV: Period of isovolumic relaxation.
Phase IV: Period of isovolumic relaxation. At the end of the period of ejection (point D), the aortic valve closes, and the ventricular pressure falls back to the diastolic pressure level. The line labeled “IV” traces this decrease in intraventricular pressure without any change in volume. Thus, the ventricle returns to its starting point, with about 50 ml of blood left in the ventricle and at an atrial pressure of 2 to 3 mm Hg.
77
What is preload?
In assessing the contractile properties of muscle, it is important to **specify** **the degree of tension on the muscle when it begins to** **contract**, which is called the preload.
78
What is the afterload?
In assessing the contractile properties of muscle, it is important to specify the **load against which the muscle exerts its contractile force**, which is called the afterload
79
For cardiac contraction, the \_\_\_\_\_\_\_is usually considered to be the **end-diastolic pressure** when the ventricle has become filled.
preload
80
The\_\_\_\_\_\_\_\_of the ventricle is the pressure in the **aorta leading from the ventricle.**
afterload . In Figure 9-8, this corresponds to the systolic pressure described by the phase III curve of the volume-pressure diagram. (Sometimes the afterload is loosely considered to be the resistance in the circulation rather than the pressure.)
81
The importance of the concepts of preload and afterload is that in **many abnormal functional states of the heart** **or circulatio**n, the **pressure during filling of the ventricle** **(the preload),** the **arterial pressure against which the ventricle** **must contract (the afterload)**, or both are severely altered from normal.
82
Heart muscle, like skeletal muscle, uses chemical energy to provide the work of contraction. T or F
True Heart muscle, like skeletal muscle, uses chemical energy to provide the work of contraction. Approximately 70 to 90 percent of this energy is normally derived from oxidative metabolism of fatty acids with about 10 to 30 percent coming from other nutrients, especially lactate and glucose. Therefore, the rate of oxygen consumption by the heart is an excellent measure of the chemical energy liberated while the heart performs its work. The different chemical reactions that liberate this energy are discussed in Chapters 67 and 68. Experimental studies have shown that oxygen consumption of the heart and the chemical energy expended during contraction are directly related to the total shaded area in Figure 9-8. This shaded portion consists of the external work (EW) as explained earlier and an additional portion called the potential energy, labeled PE. The potential energy represents additional work that could be accomplished by contraction of the ventricle if the ventricle should empty completely all the blood in its chamber with each contraction. Oxygen consumption has also been shown to be nearly proportional to the tension that occurs in the heart muscle during contraction multiplied by the duration of time that the contraction persists, called the **tension-time index.** Because tension is high when systolic pressure is high, correspondingly more oxygen is used. Also, much more chemical energy is expended even at normal systolic pressures when the ventricle is abnormally dilated because the heart muscle tension during contraction is proportional to pressure times the diameter of the ventricle. This becomes especially important in heart failure where the heart ventricle is dilated and, paradoxically, the amount of chemical energy required for a given amount of work output is greater than normal even though the heart is already failing.
83
What is the Efficiency of Cardiac Contraction?
Efficiency of Cardiac Contraction. During heart muscle contraction, most of the expended chemical energy is converted into heat and a much smaller portion into work output. The ratio of work output to total chemical energy expenditure is called the efficiency of cardiac contraction, or simply efficiency of the heart. Maximum efficiency of the normal heart is between 20 and 25 percent. In heart failure, this can decrease to as low as 5 to 10 percent
84
When a person is at rest, the heart pumps how much liters of blood each minute?
When a person is at rest, the heart pumps only 4 to 6 liters of blood each minute
85
During severe exercise, the heart may be required to pump **four to seven times this amount.** The basic means by which the volume pumped by the heart is regulated are
* (1) intrinsic cardiac regulation of pumping in response to changes in volume of blood flowing into the heart and * (2) control of heart rate and strength of heart pumping by the autonomic nervous system.
86
What is venous return?
the amount of blood pumped by the heart each minute is **normally determined almost entirely by the rate of blood flow into the heart from the veins,** which is called venous return. That is, **each peripheral tissue of the body controls its own local blood flow,** and all the local tissue flows combine and return by way of the veins to the right atrium. The heart, in turn, automatically pumps this incoming blood into the arteries so that it can flow around the circuit again.
87
What is the Frank- Starling mechanism of the heart?
This intrinsic ability of the heart to adapt to increasing volumes of inflowing blood is called the Frank- Starling mechanism of the heart, in honor of Otto Frank and Ernest Starling, two great physiologists of a century ago. Basically, the Frank-Starling mechanism means that **the greater the heart muscle is stretched during filling, the greater is the force of contraction and the greater the quantity of blood pumped into the aorta**. Or, stated another way: ***Within physiologic limits, the heart pumps all the blood that returns to it by the way of the veins.***
88
What Is the Explanation of the Frank-Starling Mechanism?
When an extra amount of blood flows into the ventricles, the **cardiac muscle itself is stretched to greater length.** **This in turn causes the muscle to contract with increased force because the actin and myosin filaments are brought to a more nearly optimal degree of overlap for force generation**. Therefore, the ventricle, because of its increased pumping, automatically pumps the extra blood into the arteries. This ability of stretched muscle, up to an optimal length, to contract with increased work output is characteristic of all striated muscle, as explained in Chapter 6, and is not simply a characteristic of cardiac muscle In addition to the important effect of lengthening the heart muscle, still another factor increases heart pumping when its volume is increased. Stretch of the right atrial wall directly increases the heart rate by 10 to 20 percent; this, too, helps increase the amount of blood pumped each minute, although its contribution is much less than that of the Frank-Starling mechanism
89
What is the ventricular function curves?
One of the best ways to express the functional ability of the ventricles to pump blood is by **ventricular function curves,** as shown in Figures 9-10 and 9-11. Figure 9-10 shows a type of ventricular function curve called the **stroke work output curve.** Note that **as the atrial pressure for each side of the heart increases,** the **stroke work output for that side increases until it reaches the limit of the ventricle’s pumping ability.** Figure 9-11 shows another type of ventricular function curve called the ventricular volume output curve. The two curves of this figure represent function of the two ventricles of the human heart based on data extrapolated from lower animals. As the right and left atrial pressures increase, the respective ventricular volume outputs per minute also increase. Thus, ventricular function curves are another way of expressing the Frank-Starling mechanism of the heart. That is, as the ventricles fill in response to higher atrial pressures, each ventricular volume and strength of cardiac muscle contraction increase, causing the heart to pump increased quantities of blood into the arteries
90
The pumping effectiveness of the heart also is controlled by the **sympathetic and parasympathetic (vagus) nerves,** which abundantly supply the heart, as shown in Figure 9-12. For given levels of atrial pressure, the amount of blood pumped each minute (cardiac output) often can be increased more than 100 percent by \_\_\_\_\_\_\_\_
sympathetic stimulation.
91
The pumping effectiveness of the heart also is controlled by the sympathetic and parasympathetic (vagus) nerves, which abundantly supply the heart, as shown in Figure 9-12. For given levels of atrial pressure, the amount of blood pumped each minute (cardiac output) often can can be decreased to as **low as zero or almost zero** by vagal\_\_\_\_\_\_\_\_\_\_\_
(parasympathetic) stimulation.
92
Mechanisms of Excitation of the Heart by the Sympathetic Nerves
Strong sympathetic stimulation can increase the heart rate in young adult humans from the normal rate of **70 beats/min up to 180 to 200 and, rarely, even 250 beats/min.** Also, sympathetic stimulation **increases the force of heart contraction to as much as double normal,** thereby increasing the volume of blood pumped and increasing the ejection pressure. Thus, **sympathetic stimulation often can increase the maximum cardiac output as much as twofold to threefold**, in addition to the increased output caused by the Frank- Starling mechanism already discussed. Conversely, inhibition of the sympathetic nerves to the heart can decrease cardiac pumping to a moderate extent in the following way: Under normal conditions, the sympathetic nerve fibers to the heart discharge continuously at a slow rate that maintains pumping at about 30 percent above that with no sympathetic stimulation. Therefore, when the activity of the sympathetic nervous system is depressed below normal, this decreases both heart rate and strength of ventricular muscle contraction, thereby decreasing the level of cardiac pumping as much as 30 percent below normal
93
Parasympathetic (Vagal) Stimulation of the Heart.
Strong stimulation of the parasympathetic nerve fibers in the vagus nerves to the heart **can stop the heartbeat for a few seconds**, but then the heart **usually “escapes” and beats at a rate of 20 to 40 beats/min as long as the parasympathetic stimulation** continues. In addition, **strong vagal stimulation can decrease the strength of heart muscle contraction by 20 to 30 percent.** The **vagal fibers are distributed mainly to the atria and not much to the ventricles, where the power contraction of the heart occurs.** This explains the effect of vagal stimulation mainly to decrease heart rate rather than to decrease greatly the strength of heart contraction. Nevertheless, the great decrease in heart rate combined with a slight decrease in heart contraction strength can decrease ventricular pumping 50 percent or more.
94
Effect of Sympathetic or Parasympathetic Stimulation on the Cardiac Function Curve
Figure 9-13 shows four cardiac function curves. ``` They are similar to the ventricular function curves of Figure 9-11. However, they represent function of the entire heart rather than of a single ventricle; they show the relation between right atrial pressure at the input of the right heart and cardiac output from the left ventricle into the aorta. ``` The curves of Figure 9-13 demonstrate that at any given right atrial pressure, the cardiac output increases during increased sympathetic stimulation and decreases during increased parasympathetic stimulation. These changes in output caused by autonomic nervous system stimulation result both from changes in heart rate and from changes in contractile strength of the heart because both change in response to the nerve stimulation.
95
Effect of Potassium Ions.
Excess potassium in the extracellular fluids causes the heart to become dilated and flaccid and also slows the heart rate. Large quantities also can block conduction of the cardiac impulse from the atria to the ventricles through the A-V bundle. Elevation of potassium concentration to only 8 to 12 mEq/L—two to three times the normal value—can cause such weakness of the heart and abnormal rhythm that death occurs. These effects result partially from the fact that a high potassium concentration in the extracellular fluids decreases the resting membrane potential in the cardiac muscle fibers, as explained in Chapter 5. That is, high extracellular fluid potassium concentration partially depolarizes the cell membrane, causing the membrane potential to be less negative. As the membrane potential decreases, the intensity of the action potential also decreases, which makes contraction of the heart progressively weaker.
96
Effect of Calcium Ions
An excess of calcium ions causes effects almost exactly opposite to those of potassium ions, causing the heart to go toward spastic contraction. This is caused by a direct effect of calcium ions to initiate the cardiac contractile process, as explained earlier in the chapter. Conversely, deficiency of calcium ions causes cardiac flaccidity, similar to the effect of high potassium. Fortunately, calcium ion levels in the blood normally are regulated within a very narrow range. Therefore, cardiac effects of abnormal calcium concentrations are seldom of clinical concern.
97
Effect of Temperature on Heart Function What is the effect when the temperature is increased?
Increased body temperature, as occurs when one has fever, causes a **greatly increased heart rate, sometimes to double normal.**
98
Effect of Temperature on Heart function What is the effect when the temperature is increased?
Effect of Temperature on Heart Function Decreased temperature causes a **greatly decreased heart rate,** **falling to as low as a few beats per minute when a person is near death from hypothermia in the body temperature range of 60° to 70°F.** These effects presumably result from the fact that heat increases the permeability of the cardiac muscle membrane to ions that control heart rate, resulting in acceleration of the self- excitation process
99
Contractile strength of the heart often is enhanced temporarily by what?
by a **moderate increase in temperature**, as occurs **during body exercise, but prolonged elevation of temperature** **exhausts the metabolic systems of the hear**t and eventually causes weakness. Therefore, optimal function of the heart depends greatly on proper control of body temperature by the temperature control mechanisms explained in Chapter 73.
100
Increasing the Arterial Pressure Load (up to a Limit) Does Not Decrease the Cardiac Output
Note in Figure 9-14 that increasing the arterial pressure in the aorta does not decrease the cardiac output until the mean arterial pressure rises above about 160 mm Hg. In other words, during normal function of the heart at normal systolic arterial pressures (80 to 140 mm Hg), the cardiac output is determined almost entirely by the ease of blood flow through the body’s tissues, which in turn controls venous return of blood to the heart. This is the principal subject of Chapter 20.
101