Chapter 1 Flashcards

(53 cards)

1
Q
  1. What is an independent variable?
A

A variable thought to be the cause of some effect. The term is usually used in experimental research to denote a variable that the experimenter has manipulated.

2
Q
  1. What is the dependent variable?
A

A variable thought to be affected by changes in an independent variable. You can think of this as an outome.

3
Q
  1. What is a predictor variable?
A

A variable thought to predict an outcome variable. This is basically another term for independent variable - some may not agree..

4
Q
  1. What is an outcome variable?
A

A variable thought to change as a function of changes in a predictor variable. This term could be synonymous with “dependent variable” for the sake of an easy life..

5
Q
  1. What is a catergorical variable?
A

A categorical variable is one that is made up of categories. An example is species (human, domestic cat, bat etc). In it’s simplest form it names just 2 things - such as male or female, dead or alive etc.

6
Q
  1. What is a continuous variable?
A

A continuous variable is one that gives a score for each participant and can take on any value on the measurment scale that is being used.

7
Q
  1. What is a binary variable?
A

A categorical variable that has only 2 possible states - eg male, female

8
Q
  1. What is a nominal variable?
A

Nominal variables can also be known as categorical variables having two or more categories without having any kind of natural order. They are variables with no real numeric value, such as occupation or political party affiliation.

9
Q
  1. What is an ordinal variable?
A

An ordinal variable is a categorical variable for which the possible values are ordered. However, these data tell us nothing about the differences between the values.

10
Q
  1. What is an interval variable?
A

An interval variable is a continuous variable where the difference between two values is meaningful. The difference between a temperature of 100 degrees and 90 degrees is the same difference as between 90 degrees and 80 degrees.

11
Q
  1. What is a ratio variable?
A

Ratio variables are similar to interval variables, but with the added condition that 0 (zero) of the measurement indicates that there is none of that variable.

Reaction time is a good example as the ratio intervals will be the same for any 50ms difference for example..

12
Q
  1. What is a discrete variable?
A

A continuous variable that can only take on certain values - usually whole numbers. Age is a good example where we usually only take the years not nono seconds!

13
Q
  1. What is measurment error?
A

Observational error (or measurement error) is the difference between a measured value of quantity and its true value. In statistics, an error is not a “mistake”.

Variability is an inherent part of things being measured and of the measurement process.

14
Q
  1. What is the difference between validity and reliability?
A
  • To ensure measurment error is kept low we can use validity and reliability to check.
  • Validity checks if the instrument used measures the variables it is meant to - while reliability checks that the measures are consistent accross different situations.
15
Q
  1. What are correlational research methods?
A
  • Correlational or cross-sectional research involves observing a natural occurence without actively interfering with the process.
  • This is very different to experimental research where we manipulate a variable to see it’s effect on another.
16
Q
  1. What is a confounding variable?
A

Confounding variables (aka third variables) are variables that the researcher failed to control, or eliminate, damaging the internal validity of an experiment.

17
Q
  1. What are the two key types of variation in statistics?
A
  1. Systematic variation (due to the experimenter doing something in one condition but not in the other)
  2. Unsystematic variation (variation results from random factors that exist between the experimental conditions - eg. natural ability ,time of day etc)
18
Q
  1. What is a repeated measures design?
A

Repeated measures design uses the same subjects with every branch of research, including the control.

For instance, repeated measurements are collected in a longitudinal study in which change over time is assessed. Other (non-repeated measures) studies compare the same measure under two or more different conditions.

19
Q
  1. What is an independent measures design?
A

An independent measures design is a type of method used during a psychology experiment that involves two or more separate groups, each containing different individuals, where each participant only takes part in each condition once.

20
Q
  1. What effects may be bad for a repeated measures design?
A
  1. Practice effects: participants may be too familiar with the second condition due to the experimental condition and/or measures being used (you could get ceiling or floor effects)
  2. Boredom effects: the second condition may have issues if participants are tired or bored after the first condition

We can counterbalance the order in which a participant gets a condition to minimise these effects..

21
Q
  1. Why is randomisation important?
A

Randomization refers to the practice of using chance methods (random number tables, flipping a coin, etc.) to assign subjects to treatments. Doing so will minimise the risk that groups differ on variables other than the one being maipulated.

22
Q
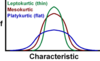
  1. What are the 2 main ways a distribution can deviate from normaility?
A
  1. Skew (lack of symetry)
  2. Kurtosis (pointiness)
23
Q
  1. Draw a diagram showing 3 Kurtosis lines.
24
Q
  1. Draw a leptokurtic distribution and a Platykurtic distribution.
A

An example of a platykurtic distribution is the uniform distribution, which does not produce outliers. Distributions with kurtosis greater than 3 are said to be leptokurtic. An example of a leptokurtic distribution is the Laplace distribution.

25
25. What is the **mode** and what are some issues with using it for analysis**?**
The **mode** is simply the number that occurs most frequently in a data set. The mode can often take on several values. See the distribution below showing both bimodal and multimodal distributions.
26
26. What is the median?
The median is simply the middle score when you order the data. When there is an even number of scores the middle 2 data points are added and divided by 2 to get the average.
27
27. What is the mean?
The mean is the measure of central tendency in a data set. Simply add up all the scores and divide by the total number. The mean can be very influenced by extream values to either end of the distribution.
28
28. What is the **range** of a distribution?
Simply the difference between the biggest and smallest data point.. x - y = the range..
29
29. What is the **interquartile range**?
The **interquartile range (IQR)** is a measure of variability, based on dividing a data set into quartiles. Quartiles divide a rank-ordered data set into four equal parts. The values that divide each part are called the first, second, and third quartiles; and they are denoted by Q1, Q2, and Q3, respectively.
30
30. What is the **z score** & what is the equation?
A z-score is a measure of how many standard deviations below or above the population mean a rawscore is. A z-score is also known as a standard score and it can be placed on a normal distribution curve. z = (score X - mean of all scores) / standard deviation
31
31. What is the **standard deviation**?
The **standard deviation (SD**, also represented by the Greek letter sigma **σ** or the Latin letter **s**) is a measure that is used to quantify the amount of variation or dispersion of a set of data values. It is simply the sqare root of the varience -
32
32. What is **varience**?
Varience is the average dispersion - calculated as: Sum of all squares / number of observations (N) - 1 * The sum of squared errors is calculated as: all deviences squared * A devience is simply the data point - the mean
33
33. What are the APA guidleines for presenting your results?
1. Choose a model of presentation that optimizes the understaing of the data 2. If you present three or fewer numbers try using a sentence 3. If you need to present between 4 and 20 numbers consider a table 4. If you need to present more than 20 numbers then a graph is often more useful than a table
34
34. What are broadly speaking the five stages of the resaerch process?
1. Generating a research question: through an initial observation (hopefully backed up by some data). 2. Generate a theory to explain your initial observation. 3. Generate hypotheses: break your theory down into a set of testable predictions. 4. Collect data to test the theory: decide on what variables you need to measure to test your predictions and how best to measure or manipulate those variables. 5. Analyse the data: look at the data visually and by fitting a statistical model to see if it supports your predictions (and therefore your theory). At this point you should return to your theory and revise it if necessary.
35
35. What is the fundamental difference between experimental and correlational research?
In a word, **causality.** In experimental research we manipulate a **variable** (predictor, independent variable) to see what effect it has on another variable (outcome, dependent variable). This manipulation, if done properly, allows us to compare situations where the causal factor is present to situations where it is absent. Therefore, if there are differences between these situations, we can attribute cause to the variable that we manipulated. In correlational research, we measure things that naturally occur and so we cannot attribute cause but instead look at natural covariation between variables.
36
36. What is the level of measurement of the following variable? • The number of downloads of different bands’ songs on iTunes:
o This is a discrete ratio measure. It is discrete because you can download only whole songs, and it is ratio because it has a true and meaningful zero (no downloads at all).
37
37. What is the level of measurement of the following variable? • The names of the bands downloaded.
This is a **nominal** variable. Bands can be identified by their name, but the names have no meaningful order. The fact that Norwegian black metal band 1349 called themselves 1349 does not make them better than British boy-band has-beens 911; the fact that 911 were a bunch of talentless idiots does, though.
38
38. What is the level of measurement of the following variable? * Band positions in the iTunes download chart.
This is an **ordinal** variable. We know that the band at number 1 sold more than the band at number 2 or 3 (and so on) but we don’t know how many more downloads they had. So, this variable tells us the order of magnitude of downloads, but doesn’t tell us how many downloads there actually were.
39
39. What is the level of measurement of the following variable? * The money earned by the bands from the downloads.
o This variable is **continuous** and **ratio**. It is continuous because money (pounds, dollars, euros or whatever) can be broken down into very small amounts (you can earn fractions of euros even though there may not be an actual coin to represent these fractions).
40
40. What is the level of measurement of the following variable? * The weight of drugs bought by the band with their royalties
o This variable is **continuous** and **ratio**. If the drummer buys 100 g of cocaine and the singer buys 1 kg, then the singer has 10 times as much.
41
41. What is the level of measurement of the following variable? * The type of drugs bought by the band with their royalties.
o This variable is **categorical** and **nominal**: the name of the drug tells us something meaningful (crack, cannabis, amphetamine, etc.) but has no meaningful order.
42
42. What is the level of measurement of the following variable? • The phone numbers that the bands obtained because of their fame.
* This variable is **categorical** and **nominal** too: the phone numbers have no meaningful order; they might as well be letters. A bigger phone number did not mean that it was given by a better person.
43
43. What is the level of measurement of the following variable? • The gender of the people giving the bands their phone numbers.
o This variable is **categorical** and **binary:** the people dishing out their phone numbers could fall into one of only two categories (male or female).
44
44. What is the level of measurement of the following variable? • The instruments played by the band members.
o This variable is **categorical** and **nominal** too: the instruments have no meaningful order but their names tell us something useful (guitar, bass, drums, etc.).
45
45. What is the level of measurement of the following variable? * The time they had spent learning to play their instruments.
o This is a **continuous** and **ratio** variable. The amount of time could be split into infinitely small divisions (nanoseconds even) and there is a meaningful true zero (no time spent learning your instrument means that, like 911, you can’t play at all).
46
46. ## Footnote Say I own 857 CDs. My friend has written a computer program that uses a webcam to scan my shelves in my house where I keep my CDs and measure how many I have. His program says that I have 863 CDs. Define measurement error. What is the measurement error in my friend’s CD counting device?
Measurement error is the difference between the true value of something and the numbers used to represent that value. In this trivial example, the measurement error is **6 CDs**. In this example we know the true value of what we’re measuring; usually we don’t have this information, so we have to estimate this error rather than knowing its actual value.
47
47. ## Footnote Sketch the shape of a **normal distribution**, a positively skewed distribution and a negatively skewed distribution.
A positive skew will be biased to the left and negative to the right...
48
48. In 2011 I got married and we went to Disney Florida for our honeymoon. We bought some bride and groom Mickey Mouse hats and wore them around the parks. The staff at Disney are really nice and upon seeing our hats would say ‘congratulations’ to us. We counted how many times people said congratulations over 7 days of the honeymoon: 5, 13, 7, 14, 11, 9, 17. Calculate the mean, median, sum of squares, variance and standard deviation of these data.
mean: 5 + 13 + 7 + 14 + 11 + 9 + 17 7 = 76/ 7 = 10.86 median, first let’s arrange the scores in ascending order: 5, 7, 9, 11, 13, 14, 17. The median will be the (n + 1)/2th score. There are 7 scores, so this will be the 8/2 = 4th. The 4th score in our ordered list is 11. To calculate the sum of squares, first take the mean from each score, then square this difference, finally, add up these squared values: The sum of squared errors is: 34.34 + 4.58 + 14.90 + 9.86 + 0.02 + 3.46 + 37.70 = 104.86. The variance is the sum of squared errors divided by the degrees of freedom (N − 1): sum of squares/ N− 1 = 104.86/ 6 = 17.48 The standard deviation is the square root of the variance: variance = 17.48 = **4.18**
49
49. In this chapter we used an example of the time taken for 21 heavy smokers to fall off a treadmill at the fastest setting (18, 16, 18, 24, 23, 22, 22, 23, 26, 29, 32, 34, 34, 36, 36, 43, 42, 49, 46, 46, 57). Calculate the sums of squares, variance and standard deviation of these data.
To calculate the sum of squares, take the mean from each value, then square this difference. Finally, add up these squared values: So, the sum of squared errors is a massive 2685.24. The **variance** is the sum of squared errors divided by the **degrees of freedom** (N − 1). There were 21 scores and so the degrees of freedom were 20. The variance is, therefore, 2685.24/20 = 134.26.
50
50. Sports scientists sometimes talk of a ‘red zone’, which is a period during which players in a team are more likely to pick up injuries because they are fatigued. When a player hits the red zone it is a good idea to rest them for a game or two. At a prominent London football club that I support, they measured how many consecutive games the 11 first team players could manage before hitting the red zone: 10, 16, 8, 9, 6, 8, 9, 11, 12, 19, 5. Calculate the mean, standard deviation, median, range and interquartile range
First we need to compute the mean: = 10 + 16 + 8 + 9 + 6 + 8 + 9 + 11 + 12 + 19 + 5 / 11 = 113/ 11 **= 10.27** the standard deviation = square root of variance! Sum of squared error = 0.07 + 32.80 + 5.17 + 1.62 + 18.26 + 5.17 + 1.62 + 0.53 + 2.98 + 76.17 + 27.80 = **172.18**. Varience = sum of squares / N-1 = 172.18/10 = 17.22 the standard deviation = square root of 17.22 = 4.15 To calculate the median, range and interquartile range, first let’s arrange the scores in ascending order: 5, 6, 8, 8, 9, 9, 10, 11, 12, 16, 19. **The median:** The median will be the (n + 1)/2th score. There are 11 scores, so this will be the 12/2 = 6th. The 6th score in our ordered list is 9 games. Therefore, the median number of games is 9. **The lower quartile:** This is the median of the lower half of scores. If we split the data at 9 (the 6th score), there are 5 scores below this value. The median of 5 = 6/2 = 3rd score. The 3rd score is 8, the lower quartile is therefore 8 games. **The upper quartile**: This is the median of the upper half of scores. If we split the data at 9 again (not including this score), there are 5 scores above this value. The median of 5 = 6/2 = 3rd score above the median. The 3rd score above the median is 12; the upper quartile is therefore 12 games. **The range**: This is the highest score (19) minus the lowest (5), i.e. 14 games. **The interquartile range**: This is the difference between the upper and lower quartile: 12 − 8 = 4 game
51
52
53