Diagrams Flashcards
(17 cards)
What does a Marginal cost curve look like?

What do the Average Variable, Fixed and Total Cost Curves look like?

What does the average revenue, demand, marginal revenue curve look like in a perfectly competitive market (price taker)?
Straight horizontal line
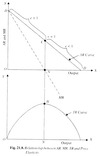
What do the TP, AP, MP curves look like?

What does supernormal profit in the short term look like in a perfectly competitive market?

What does the average revenue, demand, marginal revenue curve look like in a perfectly competitive market (price taker)?

How would the shutdown price of a firm be illustrated on a diagram?

What is the diagramatic illustration of how profits can only be normal in the long run of a perfectly competitive market?

What is the diagramatic illustration of how equilibrium is returned in a perfectly competitive market following subnormal profits?

Draw the long term market diagram of a perfectly competitive market

Draw the Market diagram for abnormal profit in a monopoly market

Diagramatically illustrate the relationship between Total revenue and PED
Draw a market diagram at the productively efficient point of output

Draw a market diagram at the allocatively efficient point of output

Draw a market diagram at the profit maximising point of output

Draw a market diagram at the revenue maximising point of output

Draw a market diagram at the sales maximising point of output

