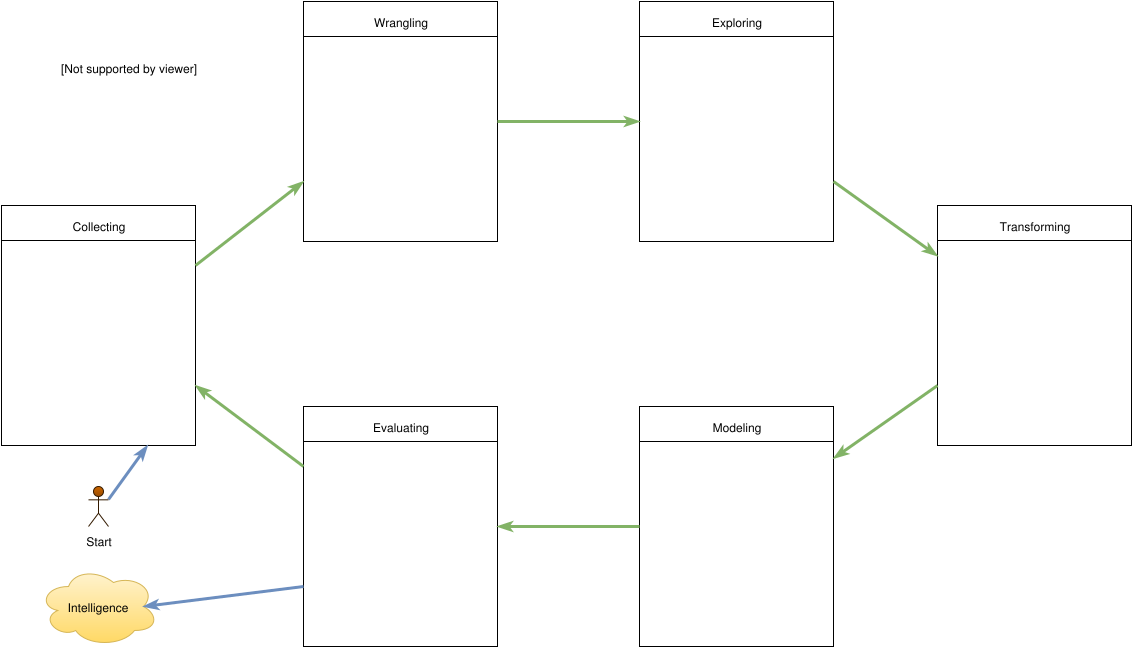
What is the Data Analysis process consist of?
- Collecting Data from various sources
- Wrangling Data to make it more reliable
- Exploring Data using statistics and visualizations
- Transforming Data to prepare it for modeling
- Modeling Data using the right machine learning algorithms
- Evaluating the results of the data models
https://courses.edx.org/asset-v1:Microsoft+DAT210x+4T2016+type@asset+block@Course_Map.pdf
What must you do before collecting data?
Before you even start doing that, you should have a question in mind to drive your data collection process.
Good to Remember:
Data might be collected from a variety of sources in the physical world, such as thermostats, smart cars, satellite transmissions, cameras, logs, and the Internet. As a data scientist, you’ll usually be given data by your clients and supervisors. But if you work on your own passion projects, it’ll be your own responsibility to amass data for analysis.
Which statement makes the most sense about data analysis?
Special care ought be dedicated to collecting data, so that you have enough to do effective analysis.
If you wanted to engage the data analysis process, the best place to start is by…
Having a question in mind to drive your data collection process
What is Machine Learning?
Machine Learning is the name given to generalizable algorithms that enable a computer to carry out a task by examining data rather than hard programming.
With machine learning, results attributed more to your data than to the algorithm, since it’s the data that instructs the computer what to do. In other words, the algorithm or task is generic; but the data is specific to the problem being solved. You might feed a specific machine learning algorithm data about food your wife likes and food she doesn’t like, and the task the algorithm accomplishes is learning how to differentiate between the two. On the other hand, she might feed the same algorithm data about clothes you like / dislike. Without altering a single line of code, the same programmed algorithm can solve the new task based solely on the data!
Another explanation of Unsupervised Learning?
Given a lot of data, the computer hasn’t the slightest idea what any of it means. Yet, it’s still able to figure out if there are any meaningful groupings and patterns within the data, along with instances where that data seems out of place!
Another explanation of Supervised Learning?
Unlike unsupervised learning where the computer had no idea what any of the data meant, with supervised learning, the computer is in charge of taking your data and then fitting rules and equations to it. Once it learns these generalized rules, the rules can be applied to data the computer has never seen before.
Basic criteria to apply machine learning or not?
Not every problem is machine solvable, nor should every problem even be approached with machine learning! If your issue is directly solvable through some simple means, such as a few yes / no decisions, or if it does not require examining loads of data, there is probably a more fitting solution for you than machine learning.
Starting with your expertise in an area, look for interesting problems to tackle. Break those problems down into smaller constituents, so that they’re either entirely solvable with machine learning, or at least partly so.
What is the difference between supervised and unsupervised learning?
Unsupervised learning attempts to extract patterns; supervised learning tries to fit rules and equations to your data
Good to know TitBit:
TensorFlow is a critical part of Google’s bread-and-butter search pipeline. Google open sourced this tool without much fear because it’s really the data and not the algorithm that drives their killer insights. With enough good data—and we all know Google knows us better than our parents, siblings, and even spouses—it is simply amazing what you can get a computer to do.
How to deciide on algorithms?
Given good data, there are a few targeted areas where machine learning really shines. If you can engineer your data driven questions into one or more of these identified areas, you can take full advantage of all machine learning has to offer using out-of-the box algorithms.
What is Classification and how does it work?
The goal of classification is to find what class a sample belongs to.
Classification falls into the realm of supervised learning because in order for it to work, you have to guide the computer by proving it with examples of correctly labeled records. Once you’re done training the computer, you can test it by seeing how accurately it scores those records.
A class could be something like Windows 10 Mobile, and a sample could be something like phone. To get classification working, you have to feed the machine learning algorithm a decent amount phone examples, some of them labeled Windows 10 Mobile, and others labeled, well… non-Windows 10 Mobile. With enough training samples, a classifier will eventually be able to generalize what similarities constitute a Windows 10 Mobile phone and voilà, you’ve trained a computer to figure out phone types!
What is Regression?
The goal of regression is to predict a continuous-valued feature associated with a sample. Continuous-valued meaning small changes in the input result in small changes in the output.
With regression, a mathematical relationship is modeled for your samples so that as you gently alter one feature, another feature responds by being altered as well.
Regression falls into the realm of supervised learning because in order for it to work, you have to provide the computer with labeled samples. It then attempts to fit an equation to the samples’ features
What is Clustering?
The goal of clustering is to automatically group similar samples into sets.
Since a clustering algorithm has no prior knowledge of how the sets should be defined, and furthermore, since the clustering process is unsupervised, the clustering algorithm needs to have a way to tell which samples are the most similar, so it can group them. It does this the same way we humans do: by looking at the various characteristics and features of the sample.
There are different types of clustering algorithms, some supervised, some unsupervised. There are even semi-supervised clustering methods as well.
What is Dimensionality Reduction (Unsupervised)?
The goal of dimensionality reduction is to systematically and intelligently reduce the number of features considered in a dataset. Stated differently, trim the fat off. Often times, in one’s eagerness to collect enough data for machine learning to be effective, you might add irrelevant features to your dataset. Bad features have the effect of hindering the machine learning process, and make your data harder to understand. Dimensionality reduction attempts to trim your dataset down to the bare essentials needed for decision-making.
Dimensionality reduction falls into the realm of unsupervised learning because you don’t instruct the computer which features you want it to build; the computer infers this information automatically by examining your unlabeled data.
What is Reinforcement Learning?
The goal of reinforcement learning is to maximize a cumulative reward function (or equivalently, minimize a cumulative cost function), given a set of actions and results. Reinforcement learning is modeled to mimic the way we learn in the real world. We try to solve problems using different techniques. Most of the time, nothing of merit results from our experiments. But occasionally, we stumble upon a set of actions that result in a sweet reward. When this happens, we attempt to repeat these actions that will result in our getting rewarded. If we are rewarded yet again, we further associate those actions with the reward and that is known as the reinforcement cycle. The entire process is also known as performance maximization.
Reinforcement learning is actually a completely different category of learning from supervised and unsupervised learning. It’s closer to supervised learning than it is to unsupervised learning, but you could get away with calling it semi-supervised learning.
For data to be usable by SciKit Learn,how should it be organized?
To be usable by SciKit-Learn, the machine learning library for Python , your data needs to be organized into matrix ofsamples and features:
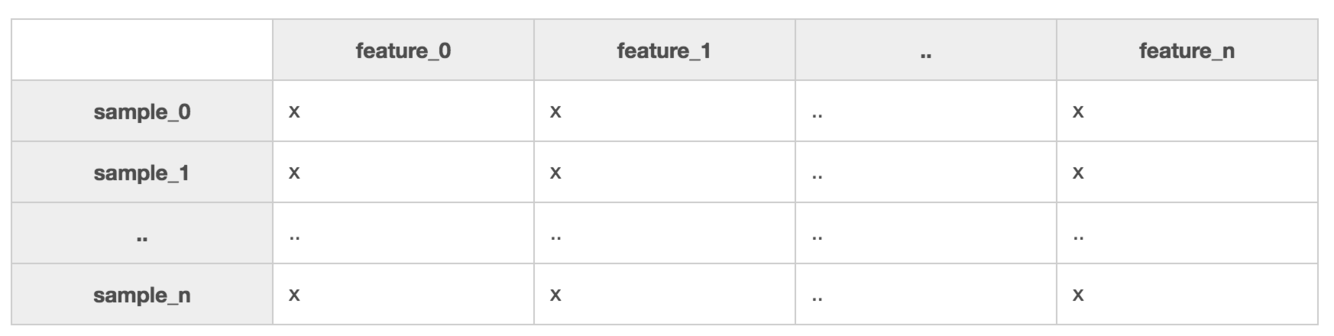
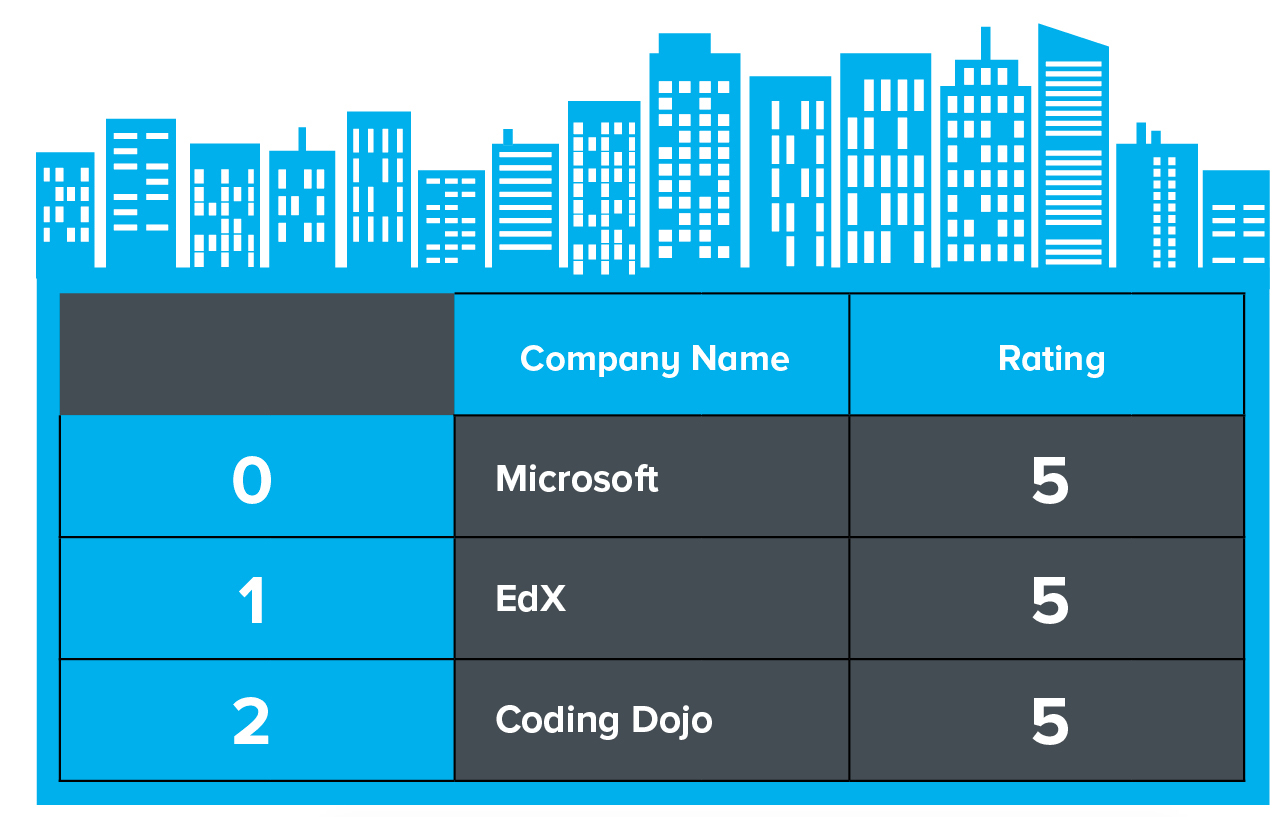
What are Features in a dataset?
Features are those quantitative traits that describe your samples. They might be numeric or textual, for example, CompanyName is a textual feature in your ‘companies’ dataset. Different samples might result in values such as ‘Microsoft’, ‘EdX’, or ‘Coding Dojo’ for the CompanyName feature. If CompanyRating were a numeric feature in the same dataset, its value might have score between 1 and 5 for each company:
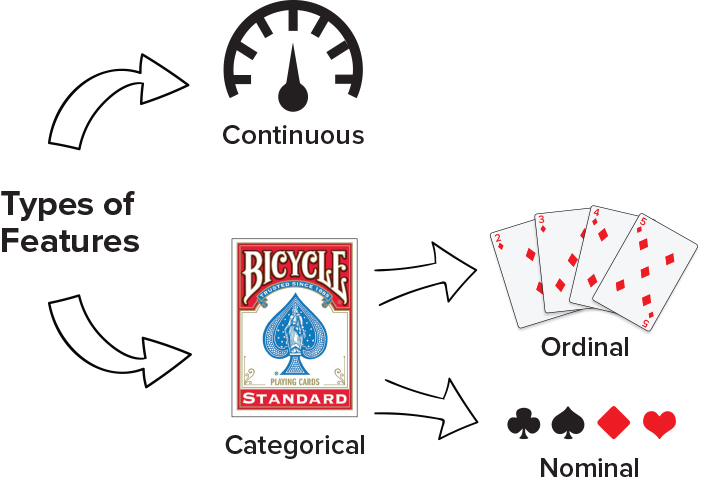
What are the different kinds of Features?
- Continuous
- Categorical ( Usually Text)
- Ordinal ( Ordered List)
- Nominal ( No Order)
What is a good rule to remember while collecting data initially?
Gather as many samles and features as possible. Do not throw away or delete any samples or features until initial data analysis.
Some time 2 or more weak features may combine together to give you a powerful effect.
Good to Remember : Data Collection and Features
One of the beauties of machine learning is its ability to discover relationships within your data you might be oblivious to. Two or more seemingly weak features, when combined, might end up being exactly that golden feature you’ve been searching for.
Good to Remember as a Data Scientist
Your machine learning goal should be to train your algorithms instead of hard coding them.
Think of your machine learning models as if they were small children who have absolutely no knowledge except what you train them with; what information would they need to know to make the right decisions?
When building out your dataset initially, what are the three things should you focus on the most?
- Collecting more samples than features, so that the mathematics required for machine learning works out well.
- Collecting features, even if independently they don’t do a great job at answering your dataset’s question.
- Let your intuition about th question, and expertise in the domain of your issue, drive you to choosing right features.
-
Python for Data Science89
-
Data Science Orientation13
-
Statistical Thinking for Data Science and Analytics94
-
Analyzing and Visualizing Data with Excel27
-
Data Science Essentials21
-
Querying with Transact-SQL56
-
Principles of Machine Learning44
-
Programming with Python for Data Science56
-
Applied Machine Learning1
-
Developing Intelligent Apps3
-
Python Pandas - Udemy91
-
Microsoft 20167
