Unit II Flashcards
(41 cards)
mean
average of set of data
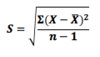
standard deviation equation
correlation study
analysis samples tested with two different methods and results are plotted on linear graph paper
degrees of freedom
n-1
coefficient of variation equation

variance
sum of the squares of the deviations of the variables from the mean divided by the total number of variables less one

coefficient of variation
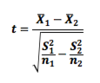
mathematical way to determine if there is a significant difference in the results obtained by two different methods for the same constituents
t-test

Variance
Gaussian distribution
another name for normal curve
median
middle value
most often repeated piece of data in a list of data
mode

standard deviation
average of set of data
mean
mean, median, and mode are all the same
normal curve
mean equation

middle value
median
dispersion of variables around the mean
standard deviation
sum of the squares of the deviations of the variables from the mean divided by the total number of variables less one
variance
normal curve
mean, median, and mode are all the same
standard deviation
dispersion of variables around the mean
mode
most often repeated piece of data in a list of data
range
difference between the highest and lowest values in the sample
n-1
degrees of freedom