Chapter 4 Flashcards
What is parameter learning / parametric modelling?
A model specified by a data miner is finetuned through the use of data mining so that the model fits the data as well as possible.
Most common examples: linear models, such as linear regression
What are some of the assumptions made in this chapter?
- First, for classification and class probability estimation we will consider only binary classes: the models predict events that either take place or do not, such as responding to an offer, leaving the company, being defrauded, etc. The methods here can all be generalized to work with multiple (nonbinary) classes, but the generalization complicates the description unnecessarily.
- Second, because we’re dealing with equations, this chapter assumes all attributes are numeric. There are techniques for converting categorical (symbolic) attributes into numerical values for use with these equations.
- Finally, we ignore the need to normalize numeric measurements to a common scale. Attributes such as Age and Income have vastly different ranges and they are usually normalized to a common scale to help with model interpretability, as well as other things (to be discussed later). We ignore these complications in this chapter. However, dealing with them is ultimately important and often necessary regardless of the data mining technique.
What are linear discriminant functions?
- A type of multivariate supervised segmentation
- Discriminates between the classes
- The function of the decision boundary is a linear combination (a weighted sum) of the attributes
- A numeric classification model
- When there are only two-dimensions, the discriminant is a line; in three dimensions a plane, +3 dimensions a hyperplane
- Provide a ranking of cases by the likelihood of belonging to one class or another.
What is a parameterised model?
- The weights of the linear function are the parameters
- Data mining fits the parameterized model to a particular dataset
- The larger the magnitude of a feature’s weight, the more important that feature is for classifying the target
I feel like these are the fundamentals that data mining tasks use.
What are Objective functions?
- A function that represents the goal and can be calculated for a particular set of weights and a particular set of data
- Finding the optimal values for the weights by maximizing or minimizing the objective function
- Note: Weights only work in our favor if the objective function actually represents what we aim to achieve
What are SVMs? How do you find the best linear discriminant?
- A type of linear discriminant
- Classifies instances based on a linear function of the features (line that separates).
- Goal: find a linear discriminant/ center line with the largest margin
- How to find the best linear discriminant?
- Start with fitting the fattest bar possible between the classes
- The wider the bar, the better
-
Center of the bar is the linear discriminant, with the largest margin possible
- Margin: the distance between the border of the bar and the center line
- Maximum margin: most leeway possible, e.g. margin for error
-
SVMs penalize a training observation for being on the “wrong” side of the decision boundary.
- If the data are not linearly separable, the best fit is some balance between a fat margin and a low total error penalty.
- The penalty function used is commonly known as Hinge Loss
- the penalty for a misclassified point is proportional to the distance from the decision boundary
- Start with fitting the fattest bar possible between the classes
What are Loss Functions and which ones should you know?
- A loss function determines how much penalty should be assigned to an instance based on the error in the model’s predicted value.
-
SVM - Hinge Loss
- No penalty for correctly classified example / instance
- Penalty for wrongly classified instance
- Loss increases linearly form the margin with further distance
- Large errors are more penalized
-
Zero-one-loss
- No loss for wrong decision
- One point for a falsely classified instance
-
Squared error
- Specifies a loss proportional to the square of the distance from the boundary
- Used for numeric value prediction (regression), rather than classification
- Would also penalize instances that are on the correct side, but far from the center line
Fitting linear functions to regression
- The common “standard” linear regression model is a powerful and convenient choice for an objective function
- Intuitive notion of the fit of the model: How far away are the predicted values (by the model) from the true values on the training data? Or how large is the error of the fitted model?
- The linear regression model structure is exactly the same as for the linear discriminant function.
- Many different objective functions for linear regression to optimise models fit to data.
- Regression problems: target variable is numeric
- Choose the best regression: sum up all the errors (one way or the other) for all data points and choose the model with the lowest minimum sum of errors
- Standard linear regression procedures minimize the sum or mean of the squares of the errors
- Any choice for the objective function has advantages and drawbacks
- Least squares regression: very sensitive to the data, e.g. outliers can severely skew the resultant linear function. Only the objective function determines if penalizing is appropriate
What’s the difference between odds and probability?
Odds is the ratio between something happening (i.e. winning) and something not happening (i.e. losing).
Probability is the ratio between something happnening and everything that could happen (i.e. winning and losing)
Why is log often applied to odds?
To normalise the magnitude differences between odds greater than 1 going to infinity and odds between 0 and 1. Since log looks at the exponent, it makes everything symmetrical and make it easy to compare.
What is the Odds ratio?
The odds ratio is the ratio of the odds of an event occurring in one group to the odds of it occurring in another group.
For example, say you’re comparing the association between a mutated gene and cancer, and you have a confusion matrix. A large odds ratio indicates that the gene is a good predictor of cancer. Conversely, a small value indicates that it isn’t a good predictor.
What is logistic regression?
Logistic regression is a model/method that has an objective function designed to give accurate estimates of class probability.
Logistic regression uses the same linear model as linear discriminants for classification and linear regression for estimating numeric target values.
Output of Logistic regression is interpreted as the log-odds of class membership. This can directly be converted to probability of class membership
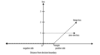
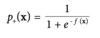
What is the logistic function?
Where f(x) is the linear function.
The model is fitted by determining the slope of the almost-linear part and thererby how quickly we are certain of the class as we move away from the boundary.
p+ is the class that we are trying to model
p+ should be as close as possible to 1 for positive instances
p+ should be as close as possible to 0 for negative instances
What is the objective function generally used by Logistic regression?
- Logistic models are estimated using maximum likelihood estimation
- The set of weights in the objective function on average give the:
- Highest probabilities to the positive examples
- Lowest probabilities to the negative examples
For Linear Discriminant, Linear regression and Logistic regression what do each estimate/predict and what is the target variable type?

What is the similarity between Decision Trees and Logistic regression and what are the key differences?
Similarity: classification trees and linear classifiers both use linear decision boundaries.
