Week 8 Flashcards
Graph the following showing all steps in the transformation from the starting graph.
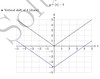
a) 𝑦=|𝑥+4|−1
start with 𝑦=𝑥+4
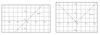
- Graph the following showing all steps in the transformation from the starting graph.
b) 𝑦=3−|𝑥−2|
start with 𝑦=𝑥−2
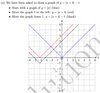
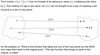
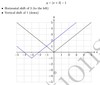
(b) We have been asked to draw a graph of y= 3−|x−2|.
- Start with a graph of y=|x|(blue)
- Reflect across the x-axis: y=−|x|(green)
- Move the graph 2 to the right: y=−|x−2|(red)
- Move the graph up 3: y=−|x−2|+ 3 (black)
- Graph the following showing all steps in the transformation from the starting graph.
c) 𝑦+2+|𝑥+1|=0
start with 𝑦=𝑥+1
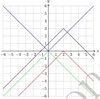
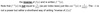
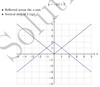
(c) We have been asked to draw a graph ofy+ 2 +|x+ 1|= 0.
- Start with a graph of y=|x|(blue)
- Reflect across the x-axis: y=−|x|(green)
- Move the graph 1 to the left: y=−|x+ 1|(red)
- Move the graph down 2: y=−|x+ 1|−2 (black)

- Sketch the following piecewise functions, stating the domain and range.
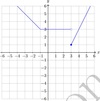
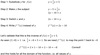
a) 𝑓(𝑥)= {𝑥−2 𝑥<−1
{𝑥+2 𝑥≥−1
a) 𝑓(𝑥)= {𝑥−2 𝑥<−1
{𝑥+2 𝑥≥−1
Domain: All real numbers OR −∞< x OR (−∞,∞)
Range:f(x)OR (−∞,−3) ∪ [1,∞)

2. Sketch the following piecewise function
a) 𝑓(𝑥)= {𝑥−2 x <−1
{𝑥+2 𝑥≥−1
i) 𝑓(−3)
𝑓(−3) =−3−2 =−5
2. Sketch the following piecewise function
a) 𝑓(𝑥)= {𝑥−2 𝑥<−1
{𝑥+2 𝑥≥−1
ii) 𝑓(0)
𝑓(0) = 0 + 2 = 2
2. Sketch the following piecewise function
a) 𝑓(𝑥)= {𝑥−2 𝑥<−1
{𝑥+2 𝑥≥−1
iii) 𝑓(−1)
𝑓(−1) =−1 + 2 = 1
2. Sketch the following piecewise functions, stating the domain and range.
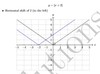
b) 𝑔(𝑥)={2−𝑥 𝑥≤−1
{3 −1<𝑥<3
{2𝑥−5 𝑥≥3
b) 𝑔(𝑥)={2−𝑥 𝑥≤−1
{3 −1<𝑥<3
{2𝑥−5 𝑥≥3
Domain: All real numbers OR −∞< x OR (−∞,∞)
Range:g(x)≥1 OR [1,∞)
2. Sketch the following piecewise function
b) 𝑔(𝑥)={2−𝑥 𝑥≤−1
{3 −1<𝑥<3
{2𝑥−5 𝑥≥3
i) 𝑔(−4)
b) 𝑔(𝑥)={2−𝑥 𝑥≤−1
{3 −1<𝑥<3
{2𝑥−5 𝑥≥3
g(−4) = 2−−4 = 6
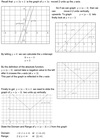
𝑦=|𝑥|
with a vertical line on either side of the 𝑥.
|𝑥|can be thought of as how far away from zero 𝑥 is, where direction is not important.
So no negatives. Hence |3|=3and |−3|=3as both +3and −3are both 3units away from the origin.
Graphing Absolute Functions
Looking at both graphs, where 𝑥 is positive (on the RHS of the y-axis), the graphs are
identical. But where 𝑥 is negative, (on LHS of 𝑦-axis) then 𝑦 = |𝑥| is a mirror image of 𝑦 =
𝑥 (reflected in the 𝑥-axis)
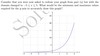
Domain and Range of 𝑦 = |𝑥|
Clearly from the graph of 𝑦 = |𝑥|
Domain: -∞ < 𝑥 < ∞
Range: 0 ≤ 𝑦 < ∞

Graph 𝑦 = |𝑥 - 3| + 2
Sketch 𝑦 = -1 - |3𝑥 + 2|

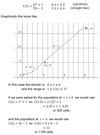
Hybrid or Piecewise Functions
Suppose you are recording some growth in population of some cells over time.
From 𝑡 = 0 to 𝑡 = 2 (hours)
the number of cells (in 100’s)
can be modelled by 𝐶(𝑡) = 𝑡2 + 1.
So at 𝑡 =0 we have
𝐶(0) = 02 + 1 = 1 (or 100) cells.
You observe that after 𝑡 = 2 the population is modelled by the equation 𝐶(𝑡) = 3𝑡 - 1 up until 𝑡 = 6
When we observe two or more functions over a set domain, we call it a hybrid or piecewise
function. Our example above can be written.

finding the Inverse Function
𝑓(𝑥) = _1/2_𝑥 + 5
Sketch
y=|x+ 2|
sketch
y=|x|−4
sketch
y=|x+ 3|−1
sketch
y=−|x|+ 2
sketch
y=−|x−1|+ 3
eval
f(-1)

f(−1)
=−(−1) + 4
= 1 + 4
= 5
eval
f(0)

f(0)
=−0 + 4
= 4
eval
f(1)

f(1)
= 2×1−1
= 2−1
= 1
eval
f(2)

f(2)
= 2×2−1
= 4−1
= 3
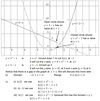
Sketch f(x)
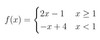
Determine the domain and range of f(x)

Domain: All (real) values of x
Range:f(x)≥1
eval
g(-3)

g(−3)
= 2−(−3)
= 2 + 3
= 5
eval
g(-2)

g(−2)
= 2−(−2)
= 2 + 2
= 4
eval
g(0)

g(0) = 3
eval
g(3)

g(3)
= 2×3−4
= 6−4
= 2
Sketch g(x)
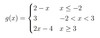
Determine the domain and range of g(x).

Domain: All (real) values of x
Range: g(x)≥2
find its inverse function
f(x) = 7x−2
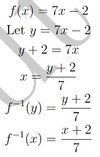
find its inverse function
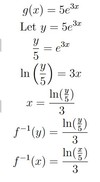
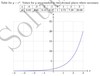
g(x) = 5e3x
find its inverse function
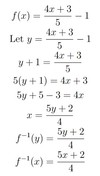
f(x) =4x+3/5−1
find its inverse function.
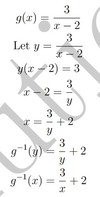
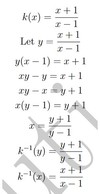
g(x) = 3/x−2
find its inverse function.
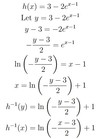
h(x) = 3−2ex−1
find its inverse function
j(x) = 2 + 5 ln(x)

Show that the inverse of
f(x) = x+ 1/x−1
is itself.
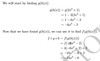
Given the functions
f(x) = 4x+ 2,
g(x) = 1−3x
and h(x) = 2x2+ 1,
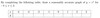
find the composite function f◦g◦h.
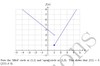
shown is old graph*