Week 10 Flashcards
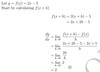
Find the derivative of the following functions by first principals (i.e. using the definition of the derivative).
y= 2x−5
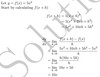
Find the derivative of the following functions by first principals (i.e. using thedefinition of the derivative).
y= 5x2
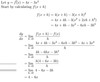
Find the derivative of the following functions by first principals (i.e. using thedefinition of the derivative)
y= 4x−3x2
Find the derivative of the following functions by first principals (i.e. using thedefinition of the derivative).
y=x2−2x+√7

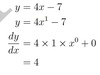
Find dydx for each of the following functions
y= 4x−7
Find dydx for each of the following functions.
y=−7x+ 2
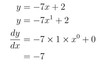
dydx
y= 3x2−4x+ 8

dydx
y= 5x3−8x2+ 9x+ 1
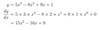
dydx
y=−6x4+ 10x3
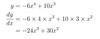
dydx
y= 6 sin(x) +x2
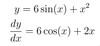
dydx
y= 9 cos(x)−3 sin(x)
dydx
y=−4 cos(x) + 7 sin(x)
dydx
y=e3x+ 4
dydx
y= 6e2x+x2

dydx
y= 10e−5x
dydx
y= 2 ln(x)

dydx
y=−4 ln(x)

dydx
y=−7 ln(x) + 4

dydx
y=4/x2
Hint: At first glance, it may not appear asthough the functions below match the table of derivatives. You may first need to rewrite the function so that it matches the table of derivatives.

dydx
y=−3√x
Hint: At first glance, it may not appear asthough the functions below match the table of derivatives. You may first need to rewrite the function so that it matches the table of derivatives.

dydx
y= 1/e2x
Hint: At first glance, it may not appear asthough the functions below match the table of derivatives. You may first need to rewrite the function so that it matches the table of derivatives.

dydx
y= 5 ln(x2)
Hint: At first glance, it may not appear asthough the functions below match the table of derivatives. You may first need to rewrite the function so that it matches the table of derivatives.

Consider the function
f(x) = 2x3+ 3x2−36x+ 12
where −6 ≤ x ≤ 4.
Determine the greatest and least values for f(x).

Consider the function
f(x) =−x2+ 6x
(a) Find the equation of the tangent to the function
f(x) at x= 2.

The population of a colony of seagulls can be modelled by
G(t) = 20t(9−t2) + 450
where G(t) is the number of seagulls and t is number of months since the research project began and 0 ≤ t ≤ 3.
(b) Calculate the rate of change of seagulls one month after the start of the research project.

The population of a colony of seagulls can be modelled by
G(t) = 20t(9−t2) + 450
where G(t) is the number of seagulls and t is number of months since the research project began and 0 ≤ t ≤ 3.
(d) Determine the greatest population of seagulls during the research project.

Oil is spilling from an oil rig at sea and has created a circular oil patch on the water.
(b) Find the rate at which the area of the oil patch is increasing with respect to the radius of the oil patch.

Oil is spilling from an oil rig at sea and has created a circular oil patch on the water.
(c) Calculate the rate at which the area of the oil patch is increasing when its radius is 15 metres.
