Topic 2/7/8 - Part 1 - Pictures/Diagrams Flashcards
Draw D-ribose
Refer to picture

Draw Alpha-D-glucose
Refer to picture

Draw Beta-D-glucose
Refer to picture

Draw a saturated fatty acid
Refer to picture

Draw an amino acid
Refer to picture

Identify the biochemical

Carbohydrate (starch)
Identify the biochemical

Lipid (triglyceride)
Identify the biochemical

Lipid (steroid)
**Make sure that you know this is a lipid
Identify the biochemical

Lipid (phospholipid)
**Make sure that you know this is a lipid
Identify the biochemical

Protein
The following diagram shows an exergonic reaction without an enzyme. Draw a corresponding diagram of the reaction when it is catalyzed by an enzyme.

Refer to picture

With the help of a graph, explain how temperature affects enzyme activity
- Low temperatures result in insufficient thermal energy for the activation of an enzyme-catalysed reaction to proceed
- Increasing the temperature will increase the speed and motion of both enzyme and substrate, resulting in higher enzyme activity
- This is because a higher kinetic energy will result in more frequent collisions between the enzymes and substrates
- At an optimal temperature (may vary for different enzymes), the rate of enzyme activity will be at its peak
- Higher temperatures will cause enzyme stability to decrease, as the thermal energy disrupts the enzyme’s hydrogen bonds
- This causes the enzyme (particularly the active site) to lose its shape, resulting in the loss of activity (denaturation)

With the help of a graph, explain how pH affects enzyme activity
- Changing the pH will alter the charge of the enzyme, which in turn will alter protein solubility and overall shape
- Changing the shape or charge of the active site will diminish its ability to bind the substrate, abrogating enzyme function
- Enzymes have an optimal pH (may differ between enzymes) and moving outside this range diminishes enzyme activity

With the help of a graph, explain how substrate concentration affects enzyme activity
- Increasing substrate concentration will increase the activity of a corresponding enzyme
- More substrates mean there is an increased chance of enzyme and substrate colliding and reacting within a given period
- After a certain point, the rate of activity will cease to rise regardless of any further increases in substrate levels
- This is because the environment is saturated with substrate and all enzymes are bound and reacting (Vmax)

Draw a diagram to demonstrate competitive inhibition
Refer to picture

Draw a diagram to demonstrate non-competitive inhibition
Refer to picture

Draw a graph of the reaction without inhibition, with competitive inhibition and with non-competiive inhibition and explain the trends
competitive inhibition:
- with increased substrate concentration, the maximum rate of the unhibited enzyme can be achieved; however it takes a much higher coentration of substrate to acheive this maximum rate
non-competitive inhibition:
- the enzyme cannot reach the same maximum rate because the binding of the non-competitive inhibitor prevents some of the enzymes from being able to react regardless ofo the substrate concentration

Identify the reaction as exergonic or endergonic

exergonic
Identify the reaction as exergonic or endergonic
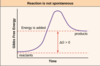
endergonic
With the help of a diagram and with reference to threonine, explain end-product inhibition
- Through a series of five reactions, the amino acid “threonine” is converted to “isoleucine”
- As the concentration of isoleucine builds up, it binds to the allosteric site of the first enzyme in the chain (threonine deaminase), thus acting as a non-competitive inhibitor

Draw a diagram to illustrate the polar property of water and hydrogen bonding.
Refer to picture

Annotate a diagram of the condensation reactions between monosaccharide monomers to form disaccharides
Refer to picture

Identify the sugar

Cellulose
Identify which is starch and which is cellulose

Starch

Identify the sugar

Amylose (starch)
Identify the sugar

Amylopectin (starch)
Identify the sugar

Glycogen
Identify the sugar

Glucose molecule (Beta-D)
Draw a labelled diagram to illustrate the formation of a triglyceride from gylcerol and fatty acids
Refer to picture

Identify whether the following picture is a cis-fatty acid or a trans-fatty acid

Trans
Identify whether the following picture is a cis-fatty acid or a trans-fatty acid

Cis
Draw a labelled diagram to illustrate the formation of a polypetide from amino acids
Refer to picture
