Follow-up: Device assessment Flashcards
Hones pattern recognition of IEGMs for various complications and arrhythmias commonly encountered in-clinic and discusses appropriate resolution. Currently weighted 10% in the CCDS exam.
True / False
Hyperkalemia typically causes loss of atrial capture before loss ventricular capture.
True.
If atrial loss of capture has occurred due to significantly increased thresholds, suspect hyperkalemia.
If a patient presents with an unusually wide QRS, what metabolic state should you consider?
Hyperkalemia.
True / False
Hyperkalemia decreases stimulation threshold.
False - Hyperkalemia increases stimulation threshold.
When looking at the pacing state histogram.
If total % of Ap state (shown as ApVp + ApVs) is greater than all other states, what can be inferred?
A large amount of pacing is likely at the base rate. Suggestive of SSS or Atrial incompetence.
When looking at pacing state histogram.
If total % of As state (shown as AsVp + AsVs) is greater than all other states, what can be inferred?
- If AsVp is large then the condition is likely CHB or the AVD is programmed too short.
- If AsVs is large then Sinus Rhythm is prevalent and pacemaker is on standby most of the time.
When looking at pacing state histogram.
If total % of Vp state (shown as AsVp + ApVp) is greater than all other states, what can be inferred?
Condition is likely CHB or AVD is programmed too short.
When looking at pacing state histogram.
If total % of Vs state (shown as AsVs + ApVs) is greater than all other states, what can be inferred.
AV conduction is present in this patient.
True / False
A normal P-wave amplitude histogram follows a bell shaped curve distribution.
True.
When viewing a P-wave amplitude histogram, there a two distinct groupings. One grouping is larger in amplitude, while another is smaller in amplitude. There is a void of data in-between the two groupings, what is most likely?
- Signals recorded in the larger amplitude group are likely sinus beats
- Signals recorded in the smaller amplitude group are likely some form of atrial tachycardia
CRT pacing shows dominant RV pacing on an ECG. The patient has CHB, RV and LV thresholds are appropriate and V-V delay is 0ms. What could be occurring at the LV site?
LV exit block or LV conduction delay due to substrate in vicinity of LV electrode.
Describe the rhythm on the IEGM.

Atrial Fibrillation with rapid ventricular response.
R-R variability is distinctive of AF. It is impossible to know 100% however as this is a single chamber device. A dual chamber device would allow true discrimination by visualising atrial activity.
Describe the rhythm on the IEGM.

Atrial tachycardia with 1:1 conduction.
Describe the rhythm on the IEGM.

2:1 AV Block
Describe the rhythm on the IEGM.

Atrial Tachycardia.
Does this patient likely have CHB or not?

Patient likely has CHB.
Note how there is no conduction of P-waves and Vp throughout the strip. This remains true even when an atrial tachycardia starts.
Is this a short duration A-Tach or A-Fib episode?

Short duration A-Tach.
Note how R-R interval is regular. The rate is also too slow to be AF.
Describe the rhythm on the IEGM.

Sinus Rhythm.
There is atrial lead noise respondent to lead damage. Unlikely to be EMI interferrence as this would display on both leads.
You ask a patient to perform provocation manouvers in clinic and witness this. Both leads are programmed Bipolar. Describe what is happening.

Atrial lead noise likely respondent to lead insulation failure.
Source of noise is likely myopotentials. Unipolar sensing would also give rise to myopotential.
Is the device detecting this bipolar lead noise? How best to program around it?

- The atrial lead noise is being detected by the device. This would inhibt output, which could be catastrophic if this was the ventricular lead in a CHB patient.
- Try programming the lead to the unipolar. Retest provocation manouvers in clinic.
- Ultimately a lead revision is necessary.
Which conductor has likely failed in the following biploar leads?

Atrial ring conductor has likely failed.
Rarer for the tip conductor to fracture first. This can be tested by programming the lead unipolar tip to can and asessing the IEGM.
What is the atrial threshold?

Atrial threshold is 1.5V.
Note how a P-wave is evident on the ECG immediately following the 1.5V stimulus but not evident immediately following the 1.4V stimulus. Note also that an intrinsic P-wave breaks through following the 1.4V stimulus, also indicating non capture.
A reversion to 2.4V inbetween is characteristic of Biotronik threshold testing and should be ignored for the purpose of threshold determination.
Describe the rhythm on the IEGM.

Atrial Flutter with variable conduction.
Rhythm is too regular to be AF.
Describe the rhythm on the IEGM.

Flutter with 2:1 conduction.
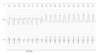
What can be said about this rate trend?

Highlights some form of sustained atrial arrhythmia at varying rates.
Patient also likely has CHB as there is little ventricular rate deviation during Tach/Sinus.
Yes / No
Is this patient likely to have experienced atrial arrhythmia? If so, which type?
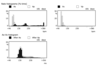
Yes - Atrial Fibrillation.
The top left graph shows atrial rights across the board from 60-400bpm. Due to an even spread its most likely the patient is ecperiencing AF. Flutter or Tach would give bunched As events at a certain rate.
True / False
This patient likely has intrinsic conduction - explain.

False.
Top right graph shows almost all V events are Vp events (white), highly suggestive of CHB. The few Vs events (Black) are likely ventricular ectopics.
The following patient has intrinsic conduction. Whats wrong and how will you correct this?

Patient is almost 100% Vp - extend AV delay or program RVp reduction algorithm.
Not only will this drain battery unnecessarily but will also put patient at risk of pacemaker syndrome.
What is the most likely arrhythmia experienced here?

Most likely AF.
Note how atrial rate is spread out across the whole rate range - thus R-R interval is highly irregular. Also atrial rates above 400bpm are almost always indicative of chaotic firing.
Why are these labeled PVCs when they’re clearly organised at regular intervals?

A device will label any V event a PVC if there is no A event preceeding it.
These could very well be conducted Sinus Beats with undetected P-waves by the device or Junctional beats with no preceeding P-wave. The device wont differentiate and instead labels them PVCs.
What is the likely arrhythmia and does this patient likely have intrinsic conduction?

Afib or Aflutter - No intrinsic conduction.
As this is a daily mean average its difficult to know whether the flutter rate was 250bpm or if the highly variable AF rate averaged to 250bpm.
Look at the V-rate throughout. It is unchanged during/after arrhythmia. Highly suspicious of CHB.
What is the RV threshold?

0.9V.
The V sensed events after 1.2V & 1.1V are ectopic beats. Clear capture can be shown at lower voltages. The stimulus of 0.8V elicits no resonse.
The device registers sinus tachycardia - is this correct?

Yes.
Narrow farfield complex, rates ~150bpm and 1:1 A:V relationship are indicitave of Sinus Tachycardia.
Onset would be helpful here as gradual onset = Sinus // Sudden onset = Atrial Tachycardia.
What is the RV threshold?

0.6V.
V sensed events following 0.9V stim are likely ectopic beats, clear capture is evidenced at lower voltages.
What is the rhythm shown?

Sinus Rhythm with 1:1 conduction.
The ‘extra beat’ seen on the atrial channel is infact farfield V sensing. It is likely the Atrial lead is placed close to the tricuspid valve and thus ‘sees’ ventricular activity.
Why are some of the atrial events labeled with ARs (FFP) and others not?

ARs (Far Field Protection) = PVARP
Those without markers = PVAB
Simply those without markers have fallen closer to the preceeding V event and fallen within the blanking period, not the refractory period. Remember the device sees things in the refractory (but doesnt act upon it) and is blind to everything within the blanking period.
Yes / No
The device is labeling the second atrial ‘Ars’ event with an amplitude - is it only measuring this impluse and missing the first?

No.
The device is not measuring the far field atrial signal, its just the number is formatted to appear in that part of the screen and the far field signal coincidenally lines up (check the V amplitude). The first atrial event is being sensed (and measured) appropriately as seen at the top by the As marker.
What is the likely arrhythmia shown by the IEGM.

VT.
More V than A events, Sudden onset of fast V rate with atrial dissociation, Farfield morphology change.
True / False
The following shows Ventricular Fibrillation.

False.
Ventricular R-R interval is stable, Ventricular amplitude is stable, Farfield morphology change
No atrial channel so this could (unlikely) be atrial tachycardia with 1:1 conduction
True / False
The following shows Atrial Tachycardia.

False - Most likely Ventricular Tachycardia.
The atrial rate is stable at approximately 90-100bpm
V rate is ~150bpm, R-R interval is regular, Broad farfield morphology
What arrhythmia is starting here?

Most likely Atrial Fibrillation
Unstable A-A intervals and varying amplitudes are suggestive of AF
Why was the circled Ap delivered despite there being multiple atrial events preceeding it?

The preceeding 3 atrial events were not counted due to either falling within the blanking or refractory periods of the atrial channel.
Yes / No
Did the circled Ap event capture, why?

No - fell too soon after a preceeding A-event.
Most likely within the refractory period of the atria, thus unable to initiate a contraction.
What does the IEGM show?

Atrial Tachycardia with 1:1 conduction.
You see this in clinic - what is it and what would you do?

Atrial lead noise giving rise to oversensing & inappropriate Mswitch. Immediate doctor consutation.
What is the Atrial threshold?

THR = 0.8V. Note how there are P-waves in lead II and II at 0.8V stimuation, but not post 0.7V.
Also see how there is intrinsic atrial breakthrough following the 0.7V stimulation, further alluding to non-capture. The IEGM signal post 0.8V looks different as it is likely a fusion beat.
What behaviour is inappropriate here?

Mswitch has incorrectly resolved as atrial arrhythmia hasn’t terminated.
This gives rise to the increase in ventricular rate seen until the Mswitch is again activated - at which point the ventricular rate drops back to the base rate.
What does the IEGM show?

Dropped p-waves giving rise to wenckebach behaviour
P-waves are dropped due to undersensing. Note how dropped p-waves are significantly smaller in amplitude (size on IEGM) than those appropriately sensed and tracked.
True / False
This shows successful ATP.

False.
Note how tachycardia continues afterwards. Note also how farfield morphology and cycle length is unchanged - thus ATP did not enter the tachycardia circuit and alter the arrhythmia in any way.
What rhythm does the IEGM show?

Sinus Rhythm with long 1st degree AVB
Why are the V-events labelled ‘PVC’ when there are clearly A events preceeding them?

The AV delay is grossly extended (480msec)
Thus the device no longer counts the Atrial event as associated to the Ventricular event.
What is the LV threshold?

1.3V
Which is the affected lead and what is the likely diagnosis?

LV lead fracture - lead displays make/break connectivity.
High impedance = more likely fracture.
Low impedance = more likely insulation failure.
True / False
The IEGM shows atrial flutter and CHB - normal function.

False - RV lead shows inappropriate sensing due to noise, thus abnormal function.
The rhythm is indeed atrial flutter with CHB.
What rhythm is shown here, anything unusual?

Likely Sinus Rhythm (regular R-R interval) - RV shows sensed lead noise.
Note how this is counting towards VF and VT counters. If left untreated this could lead to inappropriate therapy.
What type of ATP is this? Was it successful?

Successful burst ATP.
Note rate and far-field electrogram morphology changes pre/post ATP.
True / False
The patients underlying rhythm is atrial fibrillation with CHB

False - Atrial Flutter (regular P-P interval & amplitude) with CHB
What is the most likley rhythm displayed here?

Predominantly Atrial flutter (80%) with periods of Sinus p-waves (20%) with CHB throughout.
As grouping on left represents sinus activity, grouping on right represents flutter. Unlikely atrial fibrillation as the grouping is too tight (210-290bpm). Atrial fibrillation would be much wider across all rate ranges.
CHB as patient is 100% Vp.
Why does the IEGM show Ars (FFP) after every paced beat?

Retrograde P-waves are being conducted and sensed within the PVAB.
What is the likely arrhythmia shown here?

Likely AF
Note how the atrial rate is spread across all rate ranges, highlighting irregularity. Flutter would be far more concentrated to a few rate ranges.
What is the likely atrial arrhythmia? Is this conducted to the ventricles?

AF with CHB thus no intrinsic conduction.
Note 100% Vp thus most likely complete heart block patient
What was the most likley indication for this patient?

Chronotropic incompetence - majority of atrial events are paced.
Note how all ventricular events are sensed - intrinsic conduction is present.
Note also how there is evidence of atrial flutter with 20% of Atrial beats >250bpm.
True / False
The most likely rhythm is Atrial Flutter with CHB.

True.
100% Vpacing indicates no intrinsic conduction.
Atrial events are grouped tightly (210-290bpm) suggestive of flutter. Atrial Fibrillation would be across the whole rate range.
What was the shocked rhythm and was the shock successful?

VF - Chaotic & irregular. Successfully terminated with 550V shock.
True / False
This patient has intact VA conduction.

True.
Note Ars (FFP) marker post V-events. This is a retrograde P-wave being sensed by the device and falling within the PVAB.
True / False
The rhythm is most likely atrial flutter.

False.
Irregular P-P intervals and alternating p-wave amplitudes alludes to this being Atrial Fibrillation.
True / False
The rhythm is most likely Sinus Tachycardia.

True.
Rhythm shows 1:1 relationship of A and V events. AV and VA intervals remain fixed.
VT / AF with RVR
What rhythm is the most likely diagnosis?

AF with Rapid Ventricular Response.
Atrial fibrillation is clearly shown on the atrial channel. Ventricular response is both rapid and irregular - most likely in response to chaotic atrial intervals being conducted. VT would show far greater R-R stability.
True / False
The following patient doesn’t exhibit ventricular conduciton.

False.
Approximately 55% of all ventricular activity is sensed - thus intrinsic conduction must be present, most of the time.
True / False
The following IEGM shows x2 clearly defined NSVT.

False.
The cycle length shows irregularity throughout. This is more likely an example of Atrial Fibrillation with rapid ventricular response.
True / False
The likely tachycardia is Ventricular Tachycardia.

False.
Black squares represent V-sensed events. Black circles represent A-sensed events. Note how they are fixed in-line on the Y-axis at approximately 180bpm and follow one another sequentially. This illustrates A-V synchrony - thus it is likely the rhythm is atrially driven.
Burst / Ramp
Which ATP therapy is employed here?

Burst.
White squares denote V-paced events. Note how the sequence of white squares is in-line on the Y-axis at approximately 240bpm. This illustrates all paced events are at the same cycle length - burst. Remember ramp shortens the cycle length after each beat, which would lead to a upward slope on the dot plot.
What is the likely rhythm?
Ventricular Tachycardia.
Far field electrogram shows a change in morphology, however the underlying arrhythmia is still VT.
Explain why the farfield electrogram changes morphology.

VT can propogate via multiple re-entrant circuits. The example here highlights a change from one VT circuit to a different VT circuit and the corresponding alteration to the electrical signature.
True / False
The following IEGM illustrates dual lead fractures.

False - This is an example of external noise.
It is extremely unlikely to get lead noise respondent to fracture to perfectly align on both channels. Noise would be intermittent and out of sync between lead IEGMs on a device with both leads compromised. The fact noise on both leads starts/stops at the same time is suggestive of an external noise source.
What is the ventricular threshold here?

Unable to conclude.
The max output at the start is 2.6V which itself doesn’t successfully capture. Thus its impossible to determine the threshold from this IEGM.
Yes / No
Did this device appropriately Mode Switch?

No.
The atrial arrhythmia is clearly on-going after the Mswitch resolved marker. This is due to atrial undersensing, which fools the device into thinking the rate has dropped back below the Mswitch rate.
What is the ventricular threshold?

0.3V
Note how following a 0.2V stim there is no corresponding Vp on the IEGM. Following this a Vs event occurs further corroborating non-capture.
What is the RV threshold?

3.4V
Note how the 3.2V stim does not cause an electrical signal on the FF electrogram.
True / False
The following is characteristic of a steroid eluting lead.
False - Steroid eluting leads have far flatter impedance trends.
Non-steroid eluting leads typically show a rise in impedance up to 6wks post implant due to inflammation at the lead/myocardium interface.
True / False
The rhythm throughout is Sinus Tachycardia.

False. Rhythm starts as Sinus Tachycardia with VT onset.
Note the subtle ventricular rate change, FF morphology alteration and AV dissociation at the ‘Onset VT1’ marker.
What can be said with respect to the ventricular lead?

Ventricular lead exhibits make/break connectivity, highly suggestive of conductor fracture.
Note how impedance is increasing >3000ohms. High impedances typically denote fracture, low impedances typically denote insulation failure.
Yes / No
Was this therapy successful?

Yes.
A 650V shock terminated the ventricular arrhythmia.
What is the likely arrhythmia shown here?

VT.
Note stable cycle length and monomorphic appearnce on far-field IEGM.
The following appears to be VT. List a differential diagnosis and explain why.

Could be a form of conducted atrial tachycardia.
Its impossible to say for certain as this is a single chamber device. Without being able to visualise the atrial channel it is impossible to rule out this differential diagnosis.
Is the following Atrial Tachycardia with 1:1 conduction or VT with retrograde conduction?

VT with retrograde conduction.
Arrhythmia starts in the ventricle and immediately conducts to the atrial with a VA conduction time ~120ms.
Why was this ATP unsuccessful?

ATP is designed to resolve ventricular arrhythmias. This IEGM shows an atrial arrhythmia.
Note immediately following ATP therapy there is a VAAV response - this is indicative of atrial arrhythmias, to which the ventricular based ATP was inefffectual at terminating.
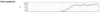
Device is programmed VVI 60. List one possible explanation for the observed ~3% pacing at 50ppm.

Night rate.
This allows the device to pace at a rate below the base rate between predefined hours.
What is the likely arrhythmia shown?

Atrial Flutter.
Paroxysmal / Persistent / Chronic
The following trend is for 12 months duration. What type of AF is exhibited?

Persistent.
Paroxysmal <1 week, Persistent >1 week, Chronic >1yr.
True / False
This patients pacing indication was likely conduction system disease.

False.
Pacing indication is likely SND / Chronotropic incompetence as evidenced by 100% Ap across the rate range. There is also an ICD indication present denoted by the ventricular therapy zones illustrated.
What two issues can you see here with respect to device function?

- Ventricular non-capture
- Ventricular undersensing
What rhythm is shown here?

Atrial flutter with CHB.
What is the likely terminating rhythm shown here?

Atrial Flutter with CHB.
CHB as pacing rate remains at baseline with little variation.
The following patient remarks of worsening HF symptoms. Why and what can be done to help?

CRT pacing % is low at 66% - Target CRT pacing should be >97%.
0% Ap events suggests active atrium. 34% AsVs shows atrial conduction which is the reason for our low CRT figure. Breaking the connection between A and V via AVNode ablation would help here.
Yes / No
Based on the IEGM - is this patient likely to be benefiting from CRT?

No.
There are large quantities of V-sensed events observed on this strip. This is due to conducted AF. Remember the goal of CRT is to achieve >97% CRT pacing.
What is the most likely arrhythmia shown?

Atrial Fibrillation.
Irregularly irregular cycle length. Ventricular arrhythmias would likely present with a broad Far-Field complex.
Explain the following IEGM.

VT with successful termination via shock.
Note broad Far-Field complexes and regular cycle length. VF would be more chaotic and irregular.
Explain the following IEGM.

VT successfully terminated with Burst ATP.
VT as broad FF complexes with fixed cycle length.
Burst as Vp events have fixed cycle length.
Explain the following IEGM.

VT with failed burst ATP.
VT as broad FF complexes with fixed cycle length.
Burst as Vp events are fixed cycle length. Note how tachycardia continues afterwards.
True / False
The observed lead noise is due to external sources.

False.
External noise would interfere with and cause noise on both Atrial and Ventricular leads. Noise on one lead isolates the problem to the respondent lead.
What rhythm is shown here?

Non-sustained ventricular tachycardia.
What is the ventricular threshold?

0.3V.
Describe the arrhythmia and why midway through the Vs events change to PVC events.

Atrial tachycardia
Atrial cycle length accelerates from ~150bpm to ~220bpm. This acceleration causes an atrial event to fall close to the preceeding V event and into its V blanking window (thus A is labeled with Ars FFP). A PVC is classed as any V event without a preceding A event. The device sees no atrial events that fall within the blanking window, thus labels the V event a PVC.
This patient has a DDD device - what is the prevailing rhythm shown here?

Atrial fibrillation with complete heart block.
AF due to broad rate spread across atrial histogram.
CHB as all V events are Vp events. If there was conduction you would see Vs events - especially with AF due to how rapidly the atrium is firing.
What is the most likely rhythm shown here?

Sinus Tachycardia.
Rhythm is stable with 1:1 AV association. Note the green ‘GRADL’ marking which denotes gradual increase in rate, not sudden onset, which is consistent with the sinus node.
What rhythm is shown here?

NSVT.
Sudden onset/offset with V sensed events that have a relatively stable cycle length.
What rhyhtm is shown here?

Atrial Tachycardia with CHB.
What rhythm is shown here?

SSS with Junctional escape.
True / False
The following shows multifocal VT.
False.
Monomorphic VT with two VEs observed.
True / False
The following shows dual tachycardia.

True.
Sinus Tachycardia with 1:1 conduction with the development of VT (note FF complex broadens and V rate overtakes A).
Why is this patient at risk of PMT?

Retrograde P-waves can be seen post BiVp.
Should the PVARP be too short, these retrograde P-waves will be tracked.
Yes / No
Did the device mode switch appropriately?

No.
This is an example of Far-Field R-wave sensing. The R-wave is sensed on the atrial channel, inappropriately triggering the Mswitch.
Patient remarks of SOBOE - what could be the cause?

Ventricular non-capture.
Note how immediately after the Vp maker there is a Vs marker. If the Vp had captured, the ventricle should be refractory and wouldnt be able to depolarize again so quickly.
What is the rhythm? Is the device function normal?

Atrial Fibrillation - No, the device exhibits atrial undersensing.
Note a lack of tick marks for each atrial event.
You perform the following test in clinic - what is the issue?

Atrial threshold test is giving RV morphology on surface ECG.
Atrial lead has likely dislodged into the RV and is now capturing RV during the Atrial threshold test. X-ray to confirm and immediate reintervention once confirmed.
Patient presents to 6wk post implant check - what do you observe?

Abnormally high impedance values at implant which have stabilized to within normal ranges.
No programming necessary at this stage, check and confirm implant values.
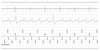
Explain the ‘wave pattern’ shown in the tachogram.

Sinus Arrhythmia
This is normal behaviour related to the inspiration/expiration cycle. Often observed in younger patients.
Yes / No
Has this device appropriately mode switched?

Yes - Atrial tachycardia appropriately detected.
Note first tachy beat is on the atrial channel with 1:1 AV relationship. Thus atrial not ventricular tachycardia.
Yes / No
Is this appropriate device function?

Yes - IEGM shows DDD with retrograde conduction.
True / False
This IEGM shows pacemaker induced VT

False
IEGM shows threshold test initiating a PMT. Note how after the 0.7V Vp, the next signal on A-channel is As. Thus the device tracks this retrograde P-wave and delivers corresponding Vp.
Yes / No
Device in situ for 3yrs. You see the following IEGM in clinic. Is this atrial dislodgement into the V?

No.

As device has been in for 3yrs, the leads will have matured making dislodgement unlikely. IEGM shows Junctional rhythm. AAI pacing reveals true location of Atrial lead.
True / False
This threshold test is being performed in DDD.

False.
Atrial threshold test is being performed in AAI - Note Vs after Ap. If there was a Vp instead of Vs, then the test would be DDD.
What is the threshold?

0.8V
The Ap at 0.7V evokes no response on the atrial IEGM. Capture in AAI also gives rise to a corresponding Vs event. There is no V event, thus the atrium was not captured.
Is there noise present here and is the device oversensing it?

Yes there is noise on the ventricular lead but the device is not sensing it.
Despite not being sensed (no Vs in line with noise). Low amplitude noise such as this requires investigation / provocation manoeuvres.
What is the most likely Arrhythmia seen here?

Atrial Flutter
Note how A-sensed rates are largely concentrated to 180bpm. Atrial Fibrillation would have a larger spread across all rates due to irregularity.
What is the likely pacemaker indication for this patient?

Complete Heart Block
Vp events are >99%, indicating no intrinsic conduction is taking place.
What rhythm is shown here?

Complete Heart Block
No association between As and Vs events. PR interval constantly changing.
The beats circled are listed as PVC’s despite the device registering a preceding As event. Why?

Interval from the preceding As event is beyond programmed AVD.
Other beats correctly labelled Vs are within the programmed AVD and thus are associated with the preceding As. Those outside the AVD have no preceding As and are hence called PVC.
Yes / No
Did this Vp capture?

No
Note a lack of waveform on the Farfield channel (top line). The intrinsic V-event afterward is also labelled VF due to short interval between Vp and Vs event. This lead is damaged and requires immediate replacement.
Yes / No
Is this VF?

No
The device is oversensing noise on the ventricular channel. Intrinsic V-events can clearly be seen corresponding to preceding A-events. The patient is in Sinus Rhythm
You see this Pt in ED having received multiple shocks. What rhythm are they in?

Sinus Rhythm

Lead is oversensing noise and requires immediate revision. Black line circled denotes device charging and aborting a shock.
You see this patient in clinic - what should you do immediately?

Place a magnet over device or de-activate therapies
Lead is detecting noise and has misdiagnosed VF. The black bar after ‘Det. VF’ marker denotes device charing for shock delivery.
Yes / No
Was this shock appropriate?

No
Device is detecting noise and incorrectly diagnosing VF. Note fractionated signals on RV channel that don’t look physiologic in any way.
What rhythm is shown here?

Sinus Rhythm
Device incorrectly detected onset of VT - this is due to lead noise.
Yes / No
Could initial VF detection be set to 30/40 in this case?

Yes
This strip shows a re-detect, hence why only 8 VF markers are required to initiate charging. Also note ‘RDT. VF’ marker. Initial VF detection typically is far longer than this. Lead noise is not relevant to this question.
What (if anything) would you draw attention to with this diagnostic report

Atrial lead impedance rise
Could be due to calcification of the lead (most likely due to gradual rise) or lead fracture (normally more abrupt increases observed).
Yes / No
Does this require emergency admission?

No
Pt is dependent, however as this is the Atrial lead its less urgent than if this was the V-lead. Also note how threshold value remains stable despite impedance rise.
What (if anything) would you draw attention to with this diagnostic report

Marked increase in short interval count
Could indicate an increase of oversensed non-physiologic noise on the lead. Investigate EGMs to confirm. Also note uptick of both impedance and threshold values, which further corroborate lead failure suspicion.
VT / SVT
Is this more likely VT or SVT?

SVT

See the 1:1 relationship between A and V. Also note highlighted atrial pause causes reciprocal ventriclar pause. If a ventricular driven tachy, the v-rate would continue regardless of atrial pause.
What Rhythm is shown here?

Atrial Fibrillation with ventricular pacing
What programming changes should be made here?

Tachy therapies turned off
Device is detecting RV lead noise and requires revision. Cannot be programmed around without compromising patient safety.
Is this VT or AF with RvR?

AF with RvR
Instability of V-rate confirms AF with RvR. Shock morphology changes due to going from Vp to Vs, thus unreliable indicator.
What is the likely arrhythmia is shown here?

Atrial Tachycardia
Note how both Atrial and Ventricular markers increase (squares and circles) above the line. This suggests a 1:1 relationship most commonly seen in SVT’s.
Yes / No
Is this VT?

No
A and V markers increase in rate in a 1:1 fashion. If this was VT only an increase in V markers would be observed.
Yes / No
Is this an SVT?

Yes
Note how the first beat of the arrhythmia is on the Atrial channel, which then conducts to the Ventricle in a 1:1 fashion.
True / False
The device has incorrectly labelled this arrhythmia as an SVT

False
This Boston device has correctly labelled this arrhythmia as an SVT using the ‘ATR’ marker.
True / False
This is likely a ventricular arrhythmia

False
Both A and V markers have increased in rate in a near 1:1 fashion, heavily suggesting an SVT.
What does this dotplot show?

Ventricular tachycardia that accelerates in rate.
What phenomena is shown here?

T-wave oversensing
List two ways one could program around this.

Increase V-sense threshold start point
Increase V-sensing decay delay
What is the threshold?

0.7V
Note narrow complex following 0.6V pace - indicating intrincic beat, not paced.
Yes / No
Was this shock appropriate?

Yes
Rhythm is ventricular based (likely VT due to regularity) without atrial involvement (not misdiagnosed SVT).
What programming change would you make in response to this?

Shock is at 20J and ineffective, thus programme higher shock output.
What induction method is depicted here?

Shock on T.
Is this tachycardia likely Atrial or Ventricular?

Atrial
Rate change is first noted in the Atrial Channel with the ventricle increasing in rate thereafter.
Why has the device labelled this as NSVT?

More sensed V events than A sensed events.
This is due to blanking periods making the device ‘blind’ to atrial events - thus arrhythmia appears V > A to the device.
You see this in clinic, what should you do?

LV IEGM shows noise. Program device RV VVI & notify doctor for lead revision.
What is the likely device indication for this patient?

Sick Sinus Syndrome - Tachy/Brady
Why are these V-sensed events labelled PVC and not Vs?

The AVD is ~400ms. The device wont associate a V-event with an A-event that occured ~400ms ago.
Device definition of PVC is V-event without preceding A-event.
Is the likely indication CHB?

No - Vp is 4% thus Vp is rarely required, indicating a good AV conduction system.
What arrhythmia is shown here?

Atrial Tachycardia.
Tachy starts with an A-event, conducts 1:1 and ends with a V-event.
What arrhythmia is shown here?

Ventricular Tachycardia.
Sudden onset in Ventricular channel with total AV dyssnchrony.
What arrhythmia is shown here?

Atrial fibrillation

Note chaotic A-sensed intervals, depicting irregularity of the atria.
What arrhythmia is shown here?

Ventricular Tachycardia (Non-sustained).
Sudden onset / offset of rapid ventricualr events.
What arrhythmia is shown here?

Atrial Flutter.
Note how regular the atrial events are. Due to regularity this is likely a re-entrant circuit tachycardia.
Why is this not atrial fibrillation?

Note how regular the atrial events are. Due to regularity this is likely a re-entrant circuit tachycardia. Atrial Fibrillation would be chaotic, with irregular atrial events.
What arrhythmia is shown here?

Atrial Fibrillation.

Note chaotic A-sensed events, with corresponding irregular V-sensed events. This is AF with periods of rapid conduction up to the VT detect zone.
Yes / No
You see this at F/U - is this normal?

No - Atrial lead exhibits gradual impedance rise with abrupt increase at end. Most likely conductor weakening, then finally complete fracture.
Yes / No
Is this an example of lead failure?

No - This noise is due to external sources.
*Note how noise is present on both channels. It’s extremely unlikely to have both leads fail at the same time. This is an example of a police tazer being used.