Algebra Flashcards
(41 cards)
When calculating required medication dosages for children and adults what is Fried’s Rule?

When calculating required medication dosages for children and adults what is Young’s Rule?

When calculating required medication dosages for children and adults what is Clark’s Rule?

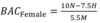
What is the formula to calculate the BAC of a female?
What is the formula to calculate the BAC of a male?
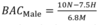
When calculating BAC what does 𝑁, 𝐻 & 𝑀 refer to?
𝑁 - The number of standard drinks consumed
𝐻 - The number of hours of drinking
𝑀 - The person’s weight in kilograms
What is the formula for calculating the number of standard drinks?
S = V x A x 0.789
When calculating the number of standard drinks what does S, V & A stand for?
- S* - Number of standard drinks
- V* - Volume of drinks in litres
- A -* The percentage of alcohol
What is a directly proportional relationship? (Direct variation)
A direct relationship indicates that two variables move in the same direction - as x increases, y increases at the same rate or as x decreases, y decreases at the same rate.
How can you tell if a graph has a direct variation?
A direct variation relationship produces a straight-line graph - going through the origin (0,0)
Which graph indicates a direct variation?
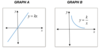
GRAPH A
In the linear function 𝑦 = 𝑚𝑥 + 𝑐 what does 𝑦 & 𝑚 refer to?
𝑦 - The y-intercept
𝑚 - The gradient
What is an inversely proportional relationship? (Inverse variation)
Inverse proportion is the relationship between two variables when their product is equal to a constant value. When the value of one variable increases, the other decreases, so their product is unchanged.
What is the constant of variation?
How can you tell if a graph has an inverse variation?
In inverse variation, the graph is a hyperbola that never passes through the origin (0,0).
What is the constant of variation?
The constant of variation is the number relating two variables that are directly proportionate or inversely proportionate to one another.
Finish the sentence…
“The gradient of a direct variation graph is the ? of variation.”
The gradient of a direct variation graph is the constant of variation.
What type of relationship between two variables does a direct variation have?
Linear relationship
What type of relationship between two variables does an inverse variation have?
Non-linear relationship
What are the limitations of a linear model in a practical context?
The most significant limitation of a linear model is that it does not work efficiently for nonlinear data. Linear regression assumes that there is a straight-line relationship between the dependent and independent variables which is often incorrect in a practical context.
A small business makes and sells bird houses. Technology was used to draw a straight-line graph to represent the cost of making bird houses (C) and the revenue from selling bird houses (R). The x-axis displays the number of bird houses and the y-axis displays the cost/revenue in dollars.
How many bird houses need to be sold to break even?

To break even 20 bird houses must be sold.
What is the point of intersection on a graph?
A point of intersection is a point where two lines meet. In the context of a business where the lines represent profits and costs, the point of intersection is referred to as the break-even point - this occurs when costs are met by profits however no revenue has been made.
Context: A company manufactures phones. The MG company’s income equation and cost equation are drawn on the same graph.
Describe which region of the graph is the profit zone and which is the cost zone?

Profit zone - Indicated through X as costs have been met by profits (at the break-even point) and revenue is being made.
Cost zone - Indicated through Z as costs have not been met by profits (at the break-even point) and therefore no revenue has been made.
Context: The graph shows the relationship between the age of a car’s engine and the car’s expected fuel consumption. Assume that the fuel price is constant over time.
Which pair of graphs best represents the fuel price over time and the amount expected to be spent on fuel as this car’s engine ages?

The answer is B. - The price is constant so the first graph will be horizontal. As the price is constant, then the second graph will be a repeat of the original graph.


