ANOVA and Regression Flashcards

(116 cards)

1
Q

Define the terms scatter plot, correlation, and regression line.

A

Scatter plot- a 2-dimensional graph of data values.

Correlation- A statistic that measures the strength and direction of a linear relationship between two quantitative variables

Regression line- an equation that describes the average relationship between a quantitative response variable and an explanatory variable

2
Q

What is Pearson’s sample correlation coefficient (r), what are its bounds, and how is it calculated?

A
3
Q

What are typical questions to ask from a scatter plot

A
  1. What is the average pattern? Does the scatter plot look like a straight line or curved? 2. What is the direction of the pattern? Negative/ Positive association? 3. How much do individual points vary from the average pattern? 4. Are there any unusual data points?
4
Q

What is the meaning if r= 1,0,-1?

A

All points fall on a straight positive line, the best straight line through the data is exactly horizontal, and all points fall on a straight negative line.

5
Q

Equation for a straight regression line

A
6
Q

Three general types of regression?

A

Simple linear regression, ploynomial regression, multiple linear regression

7
Q

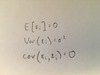
Assumptions for error term in simple linear model

A
8
Q

What are some topics of interest in regression?

A
  1. Is there a linear relationship? 2. How to describe the relationship 3. How to predict new value 4. How to predict the value of explanatory variable that causes a specified response
9
Q

What is the E[Yi] for a simple linear regression model

A
10
Q

Definitions of B1 and B0

A

B1- the slope of the regression line which indicates the change in the mean of the probability distribution of Y per unit increase in X B0- the intercept of the regression line. If 0 is in the domain of X then B0 gives the mean of the probability distribution of Y at X=0

11
Q

Are Y, X, B, eps random/fixed and known/unknown?

A

Y- Random, known X- Fixed, known B- Fixed, unknown eps- Random, unknown

12
Q

Describe the process of least squares estimation

A
13
Q

Equation for a residual

A
14
Q

Sxx, Syy, Sxy

A
15
Q

Gauss-Markov Theorem

A

Under certain assumptions (mean zero, independent, homoskedastic errors) the least squares estimators are the minimum variance unbiased estimators among all linear estimators

16
Q

Best equations for B0 and B1 using least squares estimation

A
17
Q

For simple linear regression, equation for SSE, degrees of freedom, relation to sig^2

A
18
Q

Maximum likelihood estimation, explain what changes with regression from LSE.

A

MLE assumes normality. B estimators are the same but estimators for sig^2 differ. We get SSE/n for MLE which is biased, but asymptotically unbiased. Normal assumption necessary for testing and interval construction

19
Q

J and n in terms of 1 vectors

A

J- 11’ n-1’1

20
Q

H matrix

A

X(X’X)^-1 X’

21
Q

Linear form of y

A

By

22
Q

Quadratic form of y

A

y’Ay

23
Q

Quadratic forms are common in linear models as a way of _____ The sum of squares can be decomposed in terms of _______ A quadratic form of normal Y is _______ Independence of quadratic forms is based on _________

A

expressing variation quadratic forms Chi-squared distribution idempotent matrices

24
Q

If l1=B1y and l2=B2y then what is cov(l1,l2)

A

cov(l1,l2)=B1cov(y)B2’

25
What does the trace function do?
It is the sum of the diagonals of a square matrix
26
If q=y'Ay where Y~N(u,V) then E[q]=
E[q]=u'Au+tr(AV)
27
Matrix expression of LSE
28
(X'X)^-1
29
Matrix expression of e and var(e)
30
Matrix expression of SST, SSE, SSR
31
E[Bhat] and Var[Bhat]
32
For y~N(u,V), if l=By and q=y'Ay with A symmetric and idempotent, then how to show l and q are independent?
Show BVA=0
33
For y~N(u,V), q1=y'A1y and q2=y'A2y then how to show q1 and q2 are independent.
Show A1VA2=0
34
For y~N(0,V), q=y'Ay then q~\_\_\_\_ where ____ idempotent
Chi-squared with rank(A) AV idempotent
35
For y~N(0,1), q=y'Ay then how to obtain t distribution
36
How to obtain F distribution (two ways)
37
Why use centered regression?
Centered regression (xi-xbar) helps to reduce the ill effect caused by high correlations among the columns (covariates) this is collinearity and det(X'X)=0 so therefore (X'X)-1 does not exist. “collinearity” means a “near-linear” relationship (high correlation coefficient) among covariate
38
Cov(B\*\_0,B\*\_1), [centered regression]
39
t distribution and statistic for simple linear regression
40
What to show for a t-distribution (3 things)
1) the numerator is distributed normally 2) the denominator is distributed chi-square 3) the numerator is independent from the denominator
41
CI for B0 and B1 in simple linear regression
42
Testing procedure for if multiple slopes are zero
43
ANOVA table for simple linear regression
44
R^2 (two ways)
45
R^2 in centering
46
What are the two meanings for prediction
47
What distribution does B\_0 hat + B\_1 hat x\_new follow?
48
(1-alpha)% CI for E(Y|X=x\_new)
49
(1-alpha)% PI for E(Y|X=x\_new)
50
What in words is the Bonferroni correction method?
Divide the alpha level by m where m is number of confidence intervals for which simultaneous coverage is desired
51
Explain the Scheffe method
52
Explain in words the assumption of linearity and how to check
The assumption that a linear model is actually a good fit for the data. Can be checked by inspecting scatter plots for a linear relationship between that variable and the response as well as by inspecting residual plots for patterns
53
Explain in words the assumption of Randomness and how to check
The assumption that there is not structure to the residuals (no pattern). The Runs test is a nonparametric method to determine structure in the residuals by counting the number of sequences of points above or below the mean/median residual. The Durbin-Watson test is applicable if the data can be arranged in time order. The test has a table and tests if correlation = 0.
54
Explain in words the assumption of homoskedasticity (constant variance) and how to check
The assumption of constant variance for the residuals. This can be tested using a scatter plot, a residual plot, or using the BF test (also called Levene's for groups) and the BP test for general constant variance
55
Explain in words the assumption of Normality of error and how to check
Normality of error can be tested by plotting the residuals using a box-plot, histogram, or normal probability plot. This can also be tested formally using the Shapiro-Wilks test, Kolmogorov-Smirnov test, or the Anderson-Darling test. Note however that normal probability plots provide no information if the assumptions of linearity or homoskedasticity have been violated
56
Define an influential point
One that simultaneously has a large absolute residual and high leverage
57
Define leverage
Leverage is the effect of that point on the regression and the leverage of the ith point can be found via element hii of the hat matrix
58
Three types of residuals and their definitions
59
Influence: how to measure, factors of influence, situations for high influence, measuring high influence
Cook's distance measures influence. It depends on two factors- leverage and size of the residual. There are three situations which can cause high influence: high residual+moderate leverage, high leverage+moderate residual, or high both. There is a large Cook's distance if Di \> Falpha, p, n-p
60
General rule of thumb for large residual
61
General depiction of Lack of fit Test
62
Model for Lack of fit Test
63
ANOVA for LoFT
64
SSPE and SSLOF in matrix notation
65
Remedial approaches (for heterogeneity of variance and nonlinearity combinations)
If nonlinearity but homogeneity of variance: change model Linearity but heterogeneity of variance: WLS or transform Heterogeneity of variance and nonlinearity: Apply a transformation If right skew data with heterogenity and nonlinearity: log transformation If count data: square root transformation If proportions: arcsin square root transformation
66
Box-Cox transformation (what it accomplishes, how, when)
67
Prediction intervals for a transformed model and confidence intervals for a transformed model\*
68
What to do when needing inference without normality assumption and procedure to accomplish this.
Bootstrap. Procedure: 1) Take a sample of n from dataset with replacement 2) Compute the statistic of interest on that dataset (usually using mean to compute parameter [x(x'x)^-1x']) 3) Repeat N times and order the N results 4) Depending on alpha, find percentiles and compute
69
Weighted Least squares: how to accomplish, when to accomplish
70
Prediction interval and confidence intervals for WLS
71
What is the model for polynomial regression
72
General ANOVA test procedure for polynomial relationship
73
In regression, what are possible repercussions for including a higher ordered term/not including a higher ordered term when there shouldn't be one/should be one.
If a higher orrder term is included that isn't in the true relationship then the result is a higher prediciton variance by the unbiased estimators. If a higher order term which should be there is not included then the estimators are no longer unbiased
74
Model for Multiple linear regression
75
What theorem still applies in Polynomial and multiple linear regression?
Gauss-Markov Theorem
76
General ANOVA test procedure for multiple linear regression
77
SSR(A|B)= (2 ways)
SSR(A,B)-SSR(B) SSE(B)-SSE(A,B)
78
R2y,x1|x2 (2 interpretations/definitions)
79
What is the hat fact?
HRHF=HFHR=HR
80
What are added variable plots (partial regression plots) and what is a valuable heuristic from their evaluation
They are plots of the two sets of residuals ei(Y|Xk) and ei(Y|Xm). If there is a nice linear relationship in the added variable plot, one should add Xz into the model
81
Describe the 3 Sequential Variable Selection Methods and their various measurements of selection
1. Forward selection (start with the null model and add the best variable individually) 2. Backward selection (start with the full model and subtract the worst variable individually) 3. Stepwise selection (start with the null model and add/subtract to maximize the desired measurement criteria) Measurement criteria: Adj R2, Mallow's Cp, AIC/BIC
82
Adjusted R2 definition (2 ways)
83
Mallow's CP definition and how to evaluate
84
Collinearity definition
Collinearity is a "near-linear" relationship (a high correlation coefficient) among covariates. It increases the variance of the estimators.
85
What does standardized regression accomplish and how does it do this?
86
VIF definition for two variables (2 ways) and rule of thumb for VIF indication
87
Some indicators of collinearity
88
4 important remarks on R2
1) Not an estimate of any population quantity unless the data are multivariate normal 2) Can be dramatically changed by how the x's are selected 3) Does not capture nonlinear relationships, only linear ones 4) Non-decreasing in the number of predictors. Adding an extra predictor will not cause R2 to decrease
89
Regression model using data from two sources (Different intercepts but same slope)
90
How to pic AIC/ BIC
Go with the smallest
91
Given a contingency table (what does this look like?) how would one attain a proportionary table and also calculate pij and pj|i?
92
Two categorical response variables are independent (in a contingency table) if...
All joint probabilities equal the product of their marginal probabilities (pij=p.jpi. for all i,j)
93
3 measures of relationships for square contingency tables
Difference in porportions, relative risk, odds
94
For a 2x2 proportion table, define difference in proportions for fixing column 1 or fixing row 1, the range, and when there is statistical independce of row/col classification
95
Relative risk definition, range, meaning of 1, and comparison to difference in porportions
96
Definition of odds, range, inverse relationship to proportion of success
97
Large sample distribution of log(theta hat [estimated odds ratio]), difference of porportions, and log(r hat [estimated relative risk])
98
Definition of odds ratio (various ways to calculate), relation to relative risk, all possible calculations given IJ table
99
3 ways to test independence for contingency tables and how
100
Test of Goodness of Fit
101
Test of Homogeneity
102
Test of Symmetry (matched pairs test, McNemar's Test)
103
Simpson's paradox
Occurs when the data are incorrectly grouped together without the relevant factor. It calls for a higher dimensional table to truly address the problem
104
Form of GLM and threee components
105
Definition of GLM
GLMs extend ordinary regression models to encompass nonnormal response distributions and modeling function of the mean
106
The response varibale in a GLM follows a distribution in the \_\_\_\_\_. What is the formula for each yi, and the canonical link
107
When Y={0,1} what GLM to use? What is this process?
108
When Y={0,1,2,...} what GLM to use? What is this process?
109
Deviance for Poisson and Binomial GLM
110
Confidence for Poisson and Binomial GLM
111
Testing procedure for slope of Weighted Least squares
112
Matrix formula for r2y,xk|{xi≠k}
113
Regression model using data from two sources (Different intercepts and slope)
114
Regression using data from two sources (Different intercepts and same slope) testing procedure that there is only one regression line
H0: There is only one regression line (B2=0) H1: There are two regression lines with different intercepts (B2≠0) Test statistic is distributed tn+m-3
115
Regression using data from two sources (Different intercepts and slopes) testing procedure that there is 1) Same intercept 2) Same slope 3) Same slope and intercept 4) The two lines are connected at x=c
116
What is the definition of a contingency table
A rectangular table having I rows for X categories and J columns for Y categories. The cells contain frequency counts of outcomes for a sample. The IxJ table is also called a cross classification table.