bivariate regression Flashcards
(19 cards)
what do social scientists try to build
real-world psych processes (mood) in attempt to predict how these processes operate under diff conditions
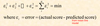
fit of the model
degree to which statistical model (predicted data) represents data collected (actual)
the mean: simple stat model of actual data that…
summarizes data/dv scores- and since it’s hypothetical, it doesnt have to a a value in observed /actual data *looks like horizontal line on graph
how to assess fit of model?
sum of squares (ss) variance (var) standard deviations (sd)
what are deviance scores
diff bw observed and model fitted data total error = sum of deviances about the mean
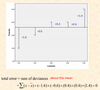
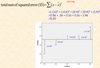
what is sum of squared errors
total amount of deviation from mean of data
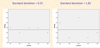
what is standard deviation and whats its utility
assess accuracy of model (predicted data) to observed/actual data
var = ss/df
SD = sqrt(ss/df)
where df = n-1
smaller sd means on avg, deviation of observed data from the mean (our predictor) is smaller and thus more accurate/ good predictor
why not just use ss to assess accuracy of predictive model to actual data?
bc ss can beome too large and beome less representative of unique deviations of each observed data pt, therefore divide ss by df to obtain variance which is approx ss per data point.
however, var must be sqrt’d to obtain sd bc original units AREN”T SQRD
sd is essentially avg error ie avg deviation for observed data from the mean to give an idea of how well observed data fits model / predicted values
how to use model to check accuracy
given IV (x axis), to predict scores on DV (y axis)
what is regression and its types
way of predicting value of 1 variable from another using hypothetical model (we use linear) of relationship bw 2 variables (IV & DV) therefore we describe the relationship using the equation of a straight line
simple regression: tries to predict DV/outcome from 1 IV/predictor
multiple regression : predicts DV from 2/+ IVs
how to find line of best fit?
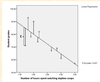
ordinary least squares criterion(ols): model that best fits the observed data ie the sum of sqrd estimated errors of prediction is minimized ie deviation of observed data from model / mean is smallest it can be for each data point
eqn to describe an unstandardized straight line
to predict DV (y axis) w IV (x axis) :
DV = y-int + rate of change * IV
y = b + ax
a or b1: regression coefficient for IV predictor / accuracy of model dependent on strength of relationship bw DV n IVrescaled r (closer to 1 or -1 means good predictor/ correlation) / slope of regression line / direction n strength of relationship bw DV, IV
b or b0: y-int when x=0 / pt where regression line crosses y-axis (ordinate)
as x incr n y decr : - relationship
if x n y go in same direction: + relationship
what to do in bivariate regression
want to find y-int (b) and slope (a) to build predictor model eqn to see how well regression model fits actual data
- estimate coefficients of regression eqn
- asses how well model predicts Y (DV)
pearson’s r provides info bout…
multiple R or R provides info bout…
r : bout size of prediction errors, closer to -/1 -> stronger relationship
R : absolute r: |r| : correlation bw actual and predicted scores, provides info bout usefulness of predictors
bivariate regression assumptions
- each X, IV score independent of other X scores while each y score indep of other y scores (sample from normal distr)
- DV, Y scores are quantitative while IV, X scores quantitative or dichotomous
3.

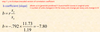
formula for slope
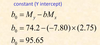
constant ie y-int formula
y-int = mean of DV - slope * mean of IV
b = My - a*Mx
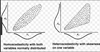
what affects pearson r (decr accuracy of predictor)
- outliers - pull mean towards them, resulting in bad model representative of all data
- range / variance restritction
- nonlinearity - if pearsons r = 0, doesnt mean variables aren’t related, just means no observed LINEAR relationship - but r only relates 2 linearly related variables
