Cardiovascular System Flashcards
(172 cards)
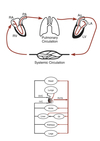
Cardiovascular Anatomy
Basics
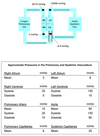
Inferior/Superior Vena Cava (spO2 ~ 75%) ⇒ Right Atrium ⇒ Tricuspid Valve ⇒ Right Ventricle ⇒ Pulmonic Valve ⇒ Pulmonary Artery ⇒ Pulmonary Circulation (~2-25 mmHg)
Pulmonary Vein (spO2 ~ 95%) ⇒ Left Atrium ⇒ Mitral Valve ⇒ Left Ventricle ⇒ Aortic Valve ⇒ Aorta ⇒ Systemic Circulation
- Pulmonary and systemic circulations arranged in a series circuit.
- All 5 L of blood can be “processed” by the lungs before being sent back into systemic circulation
- Organs within the systemic circulation are arranged in parallel circuits.
- Each organ receives fully oxygenated blood
- Flow to an organ an be changed without affecting flow to other organs
- One exception is the liver:
- Receives fresh blood via hepatic artery in parallel manner
- Receives blood from GI system via portal vein in series manner
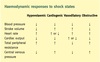
Fick’s Equation
Oxygen Consumption
A measure of O2 consumption (VO2)
VO2 = CO x (arterial O2 - venous O2)
CO = cardiac output (in liters/minute)
arterial O2 - venous O2 = the amount of oxygen extracted from the blood as it travels through the circulation
Cardiac Output
(CO)
CO = HR x SV
HR = Heart Rate
SV = stroke volume
Hemodynamics
Basics
Blood flow is proportional to the pressure difference (ΔP) not the absolute pressure.
Vast network of vessels in the sytemic circulation provides resistance to flow (R).
Largest drop-off in pressure occurs at the resistance arterioles before the capillaries.
Blood Flow
Calculation
Q = ΔP / R
Q = blood flow (cardiac output)
ΔP = pressure difference
R = resistance
R = Δ P / CO
= (MAP - CVP) / CO
MAP = mean arterial pressure
(normally ~ 95 mmHg)
CVP = central venous pressure
(pressure in the vena cava ~ 2 mmHg)
CO = cardiac output
(normally 5-6 L/min)
Average Circulatory Pressures
Blood Pressure
Maintenance
Pressure gradient must be maintained for continued flow.
Mechanisms exist to restore a decreased pressure gradient:
-
Reduce outflow
- Increase resistance to organ systems that do not have a high demand for nutrients.
- Facilitated by the parallel arrangement of organ systems.
- Controlled mainly by the sympathetic NS.
-
Increase inflow by increasing cardiac output
- Increasing heart rate
- Increasing contractility
- Through preload/inotropic state
- Causes heart to move more blood per beat
- Controlled by ANS
-
Increase blood volume
- Blood shifted from the venous system short term
- Controlled by the ANS
- Salt and water retained from the kidneys long term
- Hormonal control
- Blood shifted from the venous system short term
Venous Reservoir
- Veins experience less pressures than arteries.
- More compliant and distensible.
- 60-70% of total blood volume stored in venous system.
- Venous smooth muscle contraction activated by the sympathetic NS pushes more blood into the arterial system.

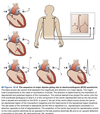
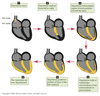
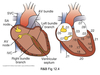
Cardiac Excitation Pathway
Wave of excitation carried by propagating action potentials.
Caused by a cycling of ionic permeability of the cell membrane.
- Action potential generated in the SA node.
- Depolarize atria.
- Depolarize AV node.
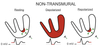
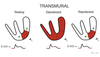
- Depolarize septum from left to right.
- Depolarize anteroseptal region of the myocardium towards the apex.
- Depolarize bulk of ventricular myocardium from endocardium to pericardium.
- Depolarize posterior portion of base of the left ventricle.
- Ventricles now depolarized.
Cardiac Action Potential
Functions
- Pacemaking by the SA node
-
Conduction of the impulse through the heart
- AV node
- bundle of His
- Purkinje fibers
- Initiating and controlling contraction
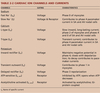
Cardiac Action Potential
Classes
Due to the types of voltage-gated ion channels present.
A reflection of the functional roles of each region.
Fast AP
contracting regions: atrial & ventricular muscle
fast conduction: bundle of His, Purkinje fibers
Slow AP
pacemaking: SA node
slow conduction: AV node
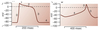
Fast Action Potentials
- Found in the atria, ventricles, and fast conducting regions of the heart (H/P system).
- Longest action potentials in the heart (up to 300 msec).
- Long plateau phase.
- Stable resting potential between AP.
Fast action potentials have 5 characteristic phases:
Phase 0
- Rapid depolarization due to the activation of inward Na+ channels (INa).
- Rate of phase 0 depolarization sets the conduction velocity.
Phase 1:
- Small initial repolarization due to the inactivation of Na+ channels (INa) and activation of a transient outward K+ channel (Ito)
Phase 2:
- Long plateau phase mediated by slowly activating inward Ca2+ channels.
- L-type ICa
- Entering calcium is the triggering Ca2+ used to activate CICR initiating atrial and ventricular contraction.
Phase 3:
- Repolarization due to inactivation of Ca2+ channels and activation of several different K+ channels (IKr, IKs)
Phase 4:
- Stable resting membrane potential due mainly to inwardly-rectifying K+ channels (IK1)
- Potassium conductance decreases transiently then come back up.
- Energy saving mechanism so that the Na+/K+-ATPase does not have to pump as much K+ back into the cell.

Slow Action Potentials
- Found in the SA and AV nodes.
- Shorter in duration.
- Rate of depolarization slower.
Slow action potentials have only 3 distinct phases:
Phase 0:
- Slow depolarization due to activation of slow-activating Ca2+ channels (L-type ICa)
Phase 1 and 2 absent.
Phase 3:
- Repolarization due to Ca2+ channel inactivation and activation of K+ channels (IKr)
Phase 4:
- Slowly depolarizing unstable resting potential due to If and IKAch channels.
- For the SA node this is how threshold is reached and AP generated.
- Rate of phase 4 depolarization sets HR
Absolute Refractory Period
An action potential cannot be elicited in a single cell regardless of the stimulus.
Effective Refractory Period
(ERP)
A propagated action potential cannot be elicited with a normal stimulus such as that generated by the SA node.
Applies to the heart as an organ.
Ensures that AP potentials travel one way.
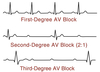
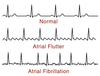
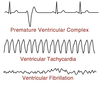
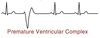
Alterations in ERP can lead to arrhythmias.
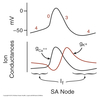
SA Node Pacemaking
Slowly depolarizing phase 4 of the SA and AV nodes provides a mechanism for pacemaking.
- Membrane slowly depolarizes until it reaches threshold at which time an AP fires.
- Rate of depolarization sets time it takes to reach threshold and thus firing rate or HR.
Spontaneous depolarization due to an imbalance between outward and inward currents:
inward > outward = depolarization
- Outward current carried by Ach-activated K+ channels (IKAch aka IGIRK)
- GIRK = G-protein coupled inwardly rectifying potassium channel
- Causes hyperpolarization
- Increased IGIRK = decreased rate of depolarization
- Stimulated by the PNS
- Inward current carried by a non-selective cation channel called HCN (If)
- Allows flow of Na+/Ca2+ into cell
- Causes depolarization
- Increased If = increased rate of depolarization
- Stimulated by SNS
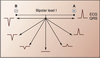
HR Modulation
Phase 4 Modulation
-
Parasympathetic (vagal) stimulation:
- Acetylcholine ⇒ muscarinic Ach receptors ⇒ increased IGIRK ⇒ K+ exits ⇒ hyperpolarization ⇒ decreased rate of phase 4 depolarization ⇒ decreased HR
- negative chronotropic effect
- trace C below
-
Sympathetic stimulation:
- Norepinephrine/epinephrine ⇒ β1 adrenergic receptors ⇒ increased If and ICa2+ ⇒ Na+ and Ca2+ entry ⇒ increased phase 4 depolarization ⇒ increased HR
- positive chronotropic effect
Diastolic Resting Potential and/or Threshold Modulation
-
Parasympathetic stimulation:
- Makes diastolic resting potential more negative
- Increases threshold
- Reduces firing rate
-
Sympathetic stimulation:
- Makes threshold more negative
- Increases firing rate
Latent Pacemakers
SA node: ~ 100 bpm
Other regions of the heart are capable of pacemaker activity:
AV node: 40-60 bpm
His/Purkinje fibers: 30-40 bpm
The pacemaker with the fastest rate of phase 4 depolarization and shortest AP controls HR = overdrive suppression.
Latent pacemakers can drive heart rate if SA node rate suppressed or latent pacemaker rate becomes faster than SA node = ectopic pacemaker.
(Ex. MI or ischemia causes decreased ox phos/ATP, reduced Na+/K+-ATPase, reduced ionic gradient, partial loss of -5mV provided by pump)
Impulse Propagation
Impulse conduction velocity depends on the rate of depolarization (Phase 0) of AP in that region.
- AP in atria, ventricle, and His/Purkinje system fast.
- AP spreads almost simultaneously due to gap junctions.
- Acts as a functional syncitium.
- AV has the slowest conduction velocity.
- Provides a delay between atrial and ventricular AP’s.
- Allows time for the ventricles to fill after atrial contraction.
- Important in effective pumping.
AV Node
Modulation
ANS can alter the conduction velocity of the AV node:
- Sympathetic stimulation increases conduction velocity = positive dromotropic effect
- NE/Epi ⇒ β1 Ad-R ⇒⇒ Inc. ICa2+ ⇒ Inc. AV velocity
- Parasympathetic stimulation decreases conduction velocity = negative dromotropic effect
- Ach ⇒ M-AchR ⇒⇒ Inc. IGIRK ⇒⇒ Dec. AV velocity
Cardiac Ion Channels
EKG
Basic Rules
- A wave of depolarization traveling towards a positive pole gives a positive voltage deflection.
- The size of the deflection is proportional to the mass of the tissue involved in the depolarization/repolarization event.
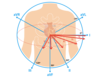
EKG Leads
3 bipolar leads: I, II, III
3 unipolar leads: aVL, aVF, aVR
6 precordial leads: V1-V6
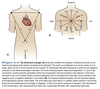
Lead 1
Positive electrode records from the left side.
Negative electrode records from the right side.
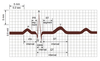
EKG Events
- AP generation at SA node not detected
-
P-wave = atrial depolarization
- Termination of P-wave when atria are completely depolarized
- Atrial repolarization obscured by ventricular depolarization
- Duration of P-wave reflects speed of propagation through atria
- PR-segment = reflects movement of AP through the AV node
- Q-wave = septal depolarization from left to right producing downward deflection
-
R-wave = AP spreading from the endocarium to the epicardium
- EKG trace upright because muscle mass of left ventricle > right ventricle
- S-wave = brief negative deflection due to upper part of ventricle depolarizing
-
QRS-complex represents the progression of ventricular depolarization
- Deflection returns to zero when entire ventricle depolarized
-
ST segment = plateau phase of AP when entirety of ventricular tissue depolarized
- Represents interval between depolarization and repolarization
-
T-wave = ventricular repolarization
- Repolarization proceeds from the epicardium to the endocardium producing a positive deflection