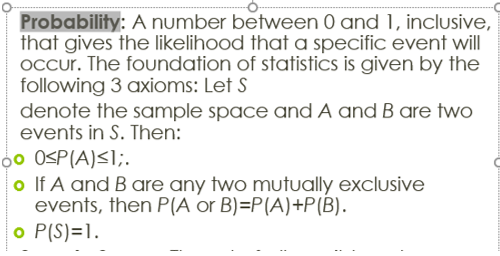
Probability
Probability- is the measure of the likeliness that an event will occur.
Event
Event – A subset in the set of all outcomes of an experiment. In other words, an event is a set of outcomes of an experiment (a subset of the sample space) to which a probability is assigned.
Ex. Getting a Tail when tossing a coin; Rolling a “7” with two dice
Sample space
Sample space – The set of all outcomes of an experiment is called a sample space and denoted usually by S. In other words, All the possible outcomes of an experiment.
Ex. choosing a card from a deck There are 52 cards in a deck (not including Jokers)
So the Sample Space is all 52 possible cards: {Ace of Hearts, 2 of Hearts, etc… }
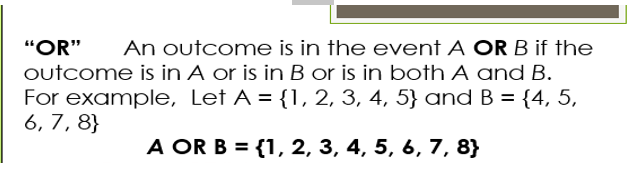
Probability OR
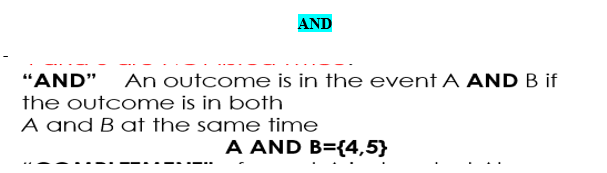
Probability AND
A = {1,2,3,4,5}
B = {4,5,6,7,8}
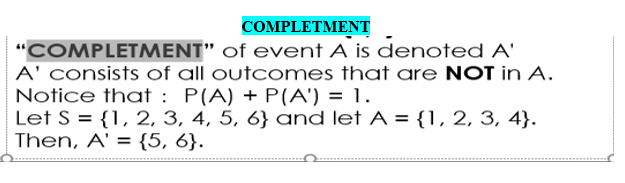
Probability COMPLETMENT
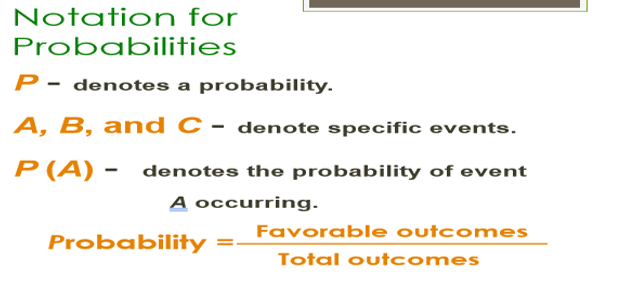
Notation for Probabilities
Probability (formal def)
Mutually Exclusive Events
Mutually exclusive events - can’t happen at the same time.
”"”P(A ∩ B) = 0 means event A & B are mutually Exclusive”!!!”“
Ex. Cards: Kings and Aces Are Mutually Exclusive.
Kings and Hearts are not, because we can have a King of Hearts!
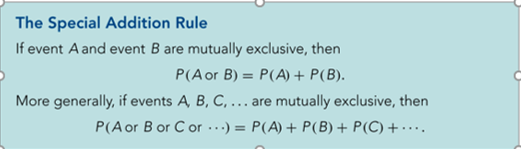
Some Rules of Probability
The special addition rule:
Some Rules of Probability
The Complementation Rule:

Some Rules of Probability
The General Addition Rule:

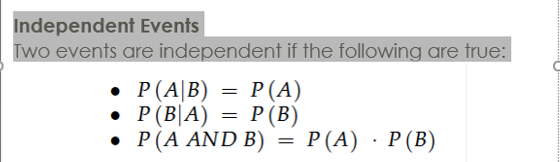
Conditional Probability
Conditional Probability:The likelihood that an event will occurgiven that another event has already occurred. The conditional probability of A Given B is written P(A|B) In other words, Events can be “Independent”, meaning each event is not affected by any other events.
Note: in words P(A|B) means the probability of event A, given that event B has already occurred.

Independent Events
Independent Events - Two events are independent if the following are true
1.) P(A | B) = P(A ∩ B) / P(B)
2.) P(B | A) = P(A ∩ B) / P(A)
3.) P(A ∩ B) = P(A) * P(B)
Equally Likely
Equally Likely: Each outcome of an experiment has the same probability.
Outcome (observation)
Outcome (observation): A particular result of an experiment.
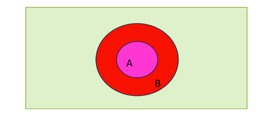
Venn Diagram
Venn Diagram - A Venn diagram is a picture that represents the outcomes of an experiment. It generally consists of a box that represents the sample space S together with circles or ovals. The circles or ovals represent events.
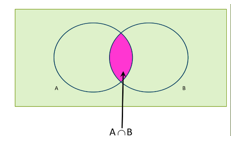
Intersection(Venn Diagram)
Intersection: Members of both set A and set B
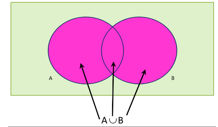
Union(Venn Diagram)
Union: Members of set A or set B or both
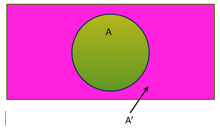
Complementary(Venn Diagram)
Complementary: Members not in the set
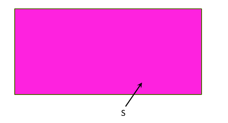
Universal Set(Venn Diagram)
Universal Set: All members
Subset(Venn Diagram)
Subset: All members of set A are in set B
Fundamental Counting Principle
Fundamental Counting Principle – using multipltion to quickly count the of ways certain things can happen if M can occur in m ways and is followed by N that can occur in n ways, than M followed by N can occur in m * n ways.
is a way to figure out the number of outcomes in a probability problem. Basically, you multiply the events together to get the total number of outcomes. The formula is:
If you have an event “a” and another event “b” then all the different outcomes for the events is a * b.
Permutations
Permutations – Any of the ways we can arrange things, where the order is important.. Placement and Position matter.(counting different ways to arrange things in order.)


