Chapter 4: Flashcards
(30 cards)
the sum of the probabilities must add up to what?
100% every outcome has an individual probability of between 0% and 100%
what does 0% indicate
impossible
what does 100% indicate
guarantee
outcomes need to be what?
- exhaustive 2. mutually exclusive
what does exhaustive mean
all possible outcomes are covered - there are no other possible outcomes
what does mutually exclusive mean
only one of the outcomes can occur at a time - only one of the outcomes can occur each time the experiment is run
what are the approaches for assigning probabilities
- Priori classical 2. empirical classical probability 3. subjective
define Priori classical probability approach
if each outcomes has an equal chance of occurring - count the number of possible outcomes and divide by 100% total into that many equal pieces (4 categories, assign each with a 35% chance for example)
define the empirical classical probability approach
what has happened in the past is a good predictor of what happens in the future - observing weathers form the past as being a good predictor for the future
what is conditional probability
the likelihood of one event or outcome if you know that another event or coutcomes has happened
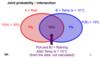
- use a Ven diagram
- ex. if you know that it is raining, what is the probability that the temperature will be greater than 10C
P(A|B) = 1 or 3 rainy days will have temp > 10 C
P(A and B) so, P(B|A) = 1/3 = 33%
P(B)
= .10/.15 = 66.7%

define the subjective probability approach
make an educated guess based on research and judgement - use when there is no historical data to look at and if we believe they are not equal split
what are the probability theories and rules
- joint 2. marginal 3. conditional probability
define joint probability
a probability that reflects the outcome of two different events
- ex. what is the probability tha tit will be raining AND that the temperature will be greater than 10C
A = rain P(A) = 30%
B = temp is greater than 10 C P(B) = 15%
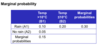
what is marginal probability
uncondintional probabiltiy
- use a joint probability table
- individual probabilites of A and B taken seperately
- use a joint probability table and
- adding up probabilites at the margins
- convert the Ven diagarms into this table
How do you calcluate Marginal Probability
well we know it must add up to one for the marginal probabilities
so we then can figure out the remainng numbers
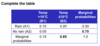
what do you also need to figure out with regards to marginal probability
whether it is indepndint or dependent
if two outcomes are independent then
the probability of one happening will be the same regardless of whether the other one happens
indepnedint if P(A) = P(A|B) or if P (B) = P(B|A)
- independent if P(Rain) = P(Rain|Temp >10)
but 30% is no equal to 67%, so these are dependent

What is probability distribuiton
all possible outcomes form an experiment and the probabilites associated with each outcome
- the probability of each outcome is between 0 and 1
- the sum of the probabilites of all outcomes equal 1
- can be a table, a graph, or a forumula
- lists the probabilities of different outcomes
what is discrete probability distirbution
the probability distirbuiton of discrete random variable
What is a discrete Random vairable?
a variable that only can have a limited number of values within a given range of values
- the number o fpossible vlaues can be counted
- dollar values, numbre of times something happens, number of objects etc
what are examples of discrete ramdon variables
dollar values, number of times somehting happnes, number of objects etc
what is a continuous random variable
a variable that can assume an infinite number of values
- the number of possible vlaues cannot be counted
Ft, time, temperature etc
What is expected value
of discrete random variables = it’s mean
- sum of each variable times its probability
what is variance?
- expected value of x squared
add more confusing


