Chapter 6 - The Normal Probability Distribution Flashcards
Variables can assume values in an uncountable set (e.g., an interval in real line).
Continuous Random Variables
A __ __ describes the probability distribution of a continuous random variable.
smooth curve
The depth or density of the probability, which varies with x, may be described by a mathematical formula f (x ), called the __ __ or__ __ __ for the random variable x.
probability distribution or probability density function
The area under the curve is equal to __.
1
P(a ≤ x ≤ b) =
area under the curve between a and b.
There is no probability attached to any single value of x. That is, P(x = a) = ?
0
Thus, P(x ≤ a) =
P(x < a)
One important continuous random variable is the __ __ __
normal random variable
Uniform Distribution The probability density function of a uniform random variable is flat:
.

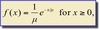
Exponential Distribution
The probability density function of an exponential random variable is:
where __ is the mean.
where µ is the mean.
__ __ variable is often used to model the lifetime of electric components
Exponential random
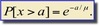
Survival probability:
Memoryless Property:

The Normal Distribution
The formula that generates the normal probability distribution is:
To find P(a < x < b), we need to find..
the area under the appropriate normal curve.

