A manager of a factory wants to know if a new quality check protocol has decreased the number of units a worker produces in a day. Before the new protocol, a worker could produce 27 units per day. What alternative hypothesis should the manager use to test this claim?
- µ ≠ 27 units
- µ ≤ 27 units
- µ < 27 units
- µ > 27 units
µ ≠ 27 units
The alternative hypothesis is the claim the manager would like to substantiate. The manager does not want to test whether the average number of units a worker can produce has increased or decreased.
µ ≤ 27 units
The alternative hypothesis is the claim the manager would like to substantiate. The manager does not want to test whether the average number of units a worker can produce has remained the same or decreased.
µ < 27 units
The manager wants to know if the new quality check protocol has decreased the average number of units a worker can produce per day. For a one-sided test, the manager should use the alternative hypothesis Ha: μ<27 units. This is the claim the manger wishes to substantiate.
µ > 27 units
The alternative hypothesis is the claim the manager would like to substantiate. The manager does not want to test whether the average number of units a worker can produce has increased.
A manager of a factory wants to know if a new quality check protocol has decreased the number of units a worker produces in a day. Before the new protocol, a worker could produce 27 units per day. What null hypothesis should the manager use to test this claim?
- µ = 27 units
- µ ≥ 27 units
- µ > 27 units
- µ < 27 units
µ = 27 units
The null and alternative hypotheses are always opposites. If the manager’s alternative hypothesis is that the average daily units produced has decreased, then the null hypothesis is that the average is the same or has increased. How would we represent that mathematically?
µ ≥ 27 units
This is the null hypothesis. Remember that the null and alternative hypotheses are opposites.
µ > 27 units
The null and alternative hypotheses are always opposites. If the manager’s alternative hypothesis is that the average daily units produced has decreased, then the null hypothesis is that the average is the same or has increased.
µ < 27 units
The null and alternative hypotheses are always opposites. If the manager’s alternative hypothesis is that the average daily units produced has decreased, then the null hypothesis is that the average is the same or has increased.
If you are performing a hypothesis test based on a 90% confidence level, what are your chances of making a type II error?
- 90%
- 10%
- 5%
- It is not possible to tell without more information
It is not possible to tell without more information
The confidence level does not provide any information about the likelihood of making a type II error. Calculating the chances of making a type II error is quite complex and beyond the scope of this course.
The mean score on a particular standardized test is 500, with a standard deviation of 100. To assess whether a training course has been effective in improving scores on the test, we take a random sample of 100 students from the course and find that the average score of this sample is 550. Which function would correctly calculate the 95% range of likely sample means under the null hypothesis?
- 550 ± CONFIDENCE.NORM(0.05,100,100)
- 550± CONFIDENCE.T(0.05,100,100)
- 500 ± CONFIDENCE.T(0.05,100,100)
- 500 ± CONFIDENCE.NORM(0.05,100,100)
550 ± CONFIDENCE.NORM(0.05,100,100)
The range of likely sample means is centered at the historical population mean, 500, not at the sample mean, 550.
550± CONFIDENCE.T(0.05,100,100)
Because our sample is larger than 30, we can assume the distribution of sample means is roughly normal, due to the central limit theorem, and use the CONFIDENCE.NORM function. In addition, the range of likely sample means is centered at the historical population mean, 500, not at the sample mean, 550.
500 ± CONFIDENCE.T(0.05,100,100)
Because our sample is larger than 30, we can assume the distribution of sample means is roughly normal, due to the central limit theorem, and use the CONFIDENCE.NORM function.
500 ± CONFIDENCE.NORM(0.05,100,100)
The range of likely sample means is centered at the historical population mean, 500. Because our sample is larger than 30, we can assume the distribution of sample means is roughly normal, due to the central limit theorem, and use the CONFIDENCE.NORM function.
Now suppose we take a sample of 25 students, taking the same standardized test, which has a mean score of 500 and a standard deviation of 100, and find that the average score of this sample is 530. Which function would correctly calculate the 95% range of likely sample means under the null hypothesis?
- 530 ± CONFIDENCE.NORM(0.05,100,25)
- 530± CONFIDENCE.T(0.05,100,25)
- 500 ± CONFIDENCE.T(0.05,100,25)
- 500 ± CONFIDENCE.NORM(0.05,100,25)
530 ± CONFIDENCE.NORM(0.05,100,25)
The range of likely sample means is centered at the historical population mean, 500, not at the sample mean, 530. In addition, because of the small sample size, we cannot assume that the sample means are normally distributed, so we should not use the CONFIDENCE.NORM function.
530± CONFIDENCE.T(0.05,100,25)
The range of likely sample means is centered at the historical population mean, 500, not at the sample mean, 530.
500 ± CONFIDENCE.T(0.05,100,25)
The range of likely sample means is centered at the historical population mean, 500. Because our sample is less than 30, we cannot assume that the sample means are normally distributed, and so we should use CONFIDENCE.T rather than the CONFIDENCE.NORM function.
500 ± CONFIDENCE.NORM(0.05,100,25)
Because of the small sample size, we cannot assume that the sample means are normally distributed, so we should not use the CONFIDENCE.NORM function.
If you are performing a hypothesis test based on a 90% confidence level, what are your chances of making a type I error?
- 90%
- 10%
- 5%
- It is not possible to tell without more information
90%
The probability of a type I error is equal to the significance level, which is 1–confidence level.
10%
The probability of a type I error is equal to the significance level, which is 1–confidence level. A 90% confidence level indicates that the significance level is 10%. Therefore there is a 10% chance of making a type I error.
5%
The probability of a type I error is equal to the significance level, which is 1–confidence level.
It is not possible to tell without more information
The confidence level provides the necessary information. The probability of a type I error is equal to the significance level, which is 1–confidence level.
If the one-sided p-value of a given sample mean is 0.0150, what is the two-sided p-value for that sample mean?
- 0.0075
- 0.0150
- 0.0300
- The answer cannot be determined without further information
0.0075
The two-sided p-value is double the one-sided p-value.
0.0150
The two-sided p-value is double the one-sided p-value.
0.0300
The two-sided p-value is double the one-sided p-value. Since the one-sided p-value is 0.0150, the two-sided p-value is 0.0150*2=0.0300.
The answer cannot be determined without further information
Since we know the one-sided p-value, we can calculate the two-sided p-value of the sample mean.
A manager of a factory wants to know if the average number of workplace accidents is different for workers who attended an equipment safety training compared to those who did not attend. What alternative hypothesis should the manager use to test this claim?
- µattended ≠ µdid not attend
- µattended > µdid not attend
- µattended < µdid not attend
- µattended = µdid not attend
µattended ≠ µdid not attend
The manager has reason to believe that the training has changed the average number of workplace accidents between the two groups of workers. For a two-sided test, the manager should use the alternative hypothesis Ha: µattended ≠ µdid not attend. This is the claim the manger wishes to substantiate.
µattended > µdid not attend
The alternative hypothesis is the claim the manager would like to substantiate. The manager does not want to test whether the average number of workplace accidents has increased for those that attended the training.
µattended < µdid not attend
The alternative hypothesis is the claim the manager would like to substantiate. The manager does not want to test whether the average number of workplace accidents has decreased for those that attended the training. While we may guess that accidents would decrease after training, the manager wishes to test for a change
µattended = µdid not attend
The alternative hypothesis is the claim the manager would like to substantiate. The manager does not want to test whether the average number of workplace accidents has remained the same.
A manager of a factory wants to know if the average number of workplace accidents is different for workers who attended an equipment safety training compared to those who did not attend. What null hypothesis should the manager use to test this claim?
- µattended > µdid not attend
- µattended ≥ µdid not attend
- µattended ≤ µdid not attend
- µattended = µdid not attend
µattended > µdid not attend
The null and alternative hypotheses are always opposites. If the manager’s alternative hypothesis is that the average number of workplace accidents has changed, then the null hypothesis is that average number of workplace accidents has remained the same. How would we represent that mathematically?
µattended ≥ µdid not attend
The null and alternative hypotheses are always opposites. If the manager’s alternative hypothesis is that the average number of workplace accidents has changed, then the null hypothesis is that average number of workplace accidents has remained the same. How would we represent that mathematically?
µattended ≤ µdid not attend
The null and alternative hypotheses are always opposites. If the manager’s alternative hypothesis is that the average number of workplace accidents has changed, then the null hypothesis is that average number of workplace accidents has remained the same. How would we represent that mathematically?
µattended = µdid not attend
If the manager’s alternative hypothesis is that the average number of workplace accidents has changed between the two groups of workers, then the null hypothesis is that the average number of accidents has remained the same.
If you are performing a hypothesis test based on a 20% significance level, what are your chances of making a type I error?
- 80%
- 10%
- 20%
- It is not possible to tell without more information
80%
The probability of a type I error is equal to the significance level, which is 1–confidence level.
10%
The probability of a type I error is equal to the significance level, which is 1–confidence level.
20%
The probability of a type I error is equal to the significance level, which is 1–confidence level.
It is not possible to tell without more information
The significance level provides the necessary information. The probability of a type I error is equal to the significance level, which is 1–confidence level.
If the two-sided p-value of a given sample mean is 0.0040, what is the one-sided p-value for that sample mean?
- 0.0020
- 0.0040
- 0.0080
- The answer cannot be determined without further information
0.0020
The one-sided p-value is half of the two-sided p-value. Since the two-sided p-value is 0.0040, the one-sided p-value is 0.0040/2=0.0020.
0.0040
The one-sided p-value is half of the two-sided p-value.
0.0080
The one-sided p-value is half of the two-sided p-value.
The answer cannot be determined without further information
Since we know the two-sided p-value, we can calculate the one-sided p-value of the sample mean.
One-sided or Two-sided hypothesis test?
TEST WHETHER INCOMING STUDENTS AT A BUSINESS SCHOOL RECEIVE BETTER GRADES IN THEIR CLASSES IF THEY’VE TAKEN AN ON-LINE PROGRAM COVERING BASIC MATERIAL
One
One-sided or Two-sided hypothesis test?
TEST WHETHER USERS OF A COMMERCIAL WEBSITE ARE LESS LIKELY TO MAKE A PURCHASE IF THEY ARE REQUIRED TO SET UP A USER ACCOUNT ON THE SITE
One
One-sided or Two-sided hypothesis test?
TEST WHETHER THERE IS A DIFFERENCE BETWEEN MEN’S AND WOMEN’S USAGE OF A MOBILE FITNESS APP
Two
One-sided or Two-sided hypothesis test?
TEST WHETHER THE NUMBER OF LISTENERS OF A STREAMING MUSIC SERVICE HAS CHANGED AFTER THEY CHANGED THE USER INTERFACE
Two
A movie theater manager wants to determine whether popcorn sales have increased since the theater switched from using “butter-flavored topping” to real butter. Historically the average popcorn revenue per weekend day was approximately $3,500. After the theater started using real butter, the manager randomly sampled 12 weekend days and calculated the sample’s summary statistics. The average revenue per weekend day in the sample was approximately $4,200 with a standard deviation of $140. Select the function that would correctly calculate the 90% range of likely sample means.
- 3,500±CONFIDENCE.T(0.10,140,12)
- 4,200±CONFIDENCE.T(0.10,140,12)
- 3,500±CONFIDENCE.NORM(0.10,140,12)
- 4,200±CONFIDENCE.NORM(0.10,140,12)
3,500±CONFIDENCE.T(0.10,140,12)
Correct. The range of likely sample means is centered at the historical population mean, in this case $3,500. Because the sample contains fewer than 30 data points, we use CONFIDENCE.T. Excel’s CONFIDENCE.T function syntax is CONFIDENCE.T(alpha, standard_dev, size). Because we wish to construct a 90% range of likely sample means, alpha equals 0.10.
4,200±CONFIDENCE.T(0.10,140,12)
The range of likely sample means is centered at the historical population mean, in this case $3,500, rather than the sample mean, in this case $4,200. Because the sample contains fewer than 30 data points, we use CONFIDENCE.T. Excel’s CONFIDENCE.T function syntax is CONFIDENCE.T(alpha, standard_dev, size). Because we wish to construct a 90% range of likely sample means, alpha equals 0.10.
3,500±CONFIDENCE.NORM(0.10,140,12)
The range of likely sample means is centered at the historical population mean, in this case $3,500. Because the sample contains fewer than 30 data points, we use CONFIDENCE.T, rather than CONFIDENCE. NORM. Excel’s CONFIDENCE.T function syntax is CONFIDENCE.T(alpha, standard_dev, size). Because this is a 90% range of likely sample means, alpha equals 0.10. Excel’s CONFIDENCE.T function syntax is CONFIDENCE.T(alpha, standard_dev, size).
4,200±CONFIDENCE.NORM(0.10,140,12)
The range of likely sample means is centered at the historical population mean, in this case $3,500, rather than the sample mean, in this case $4,200. Furthermore, because the sample contains fewer than 30 cases, we use CONFIDENCE.T rather than CONFIDENCE.NORM. Because this is a 90% range of likely sample means, alpha equals 0.10. Excel’s CONFIDENCE.T function syntax is CONFIDENCE.T(alpha, standard_dev, size).
The owner of a local health food store recently started a new ad campaign to attract more business and wants to test whether average daily sales have increased. Historically average daily sales were approximately $2,700. After the ad campaign, the owner took a random sample of forty-five days and found that daily average sales had increased to $2,984. What is store owner’s null hypothesis?
- μ≥$2,984
- μ≤$2,984
- μ=$2,984
- μ≥$2,700
- μ≤$2,700
- μ=$2,700
μ≥$2,984
The null hypothesis is the opposite of the hypothesis you are trying to substantiate. The owner wants to test for an increase. In addition, the null hypothesis is always based on historical information.
μ≤$2,984
The null hypothesis is always based on historical information.
μ=$2,984
The null hypothesis is the opposite of the hypothesis you are trying to substantiate. The owner wants to test for an increase. In addition, the null hypothesis is always based on historical information.
μ≥$2,700
The null hypothesis is the opposite of the hypothesis you are trying to substantiate. The owner wants to test for an increase. This answer would be correct if the owner wanted to test for a decrease.
μ≤$2,700
The null hypothesis is the opposite of the hypothesis you are trying to substantiate. Since the owner wants to test for an increase, the null hypothesis is μ≤$2,700. Remember that the null hypothesis is always based on historical information.
μ=$2,700
The null hypothesis is the opposite of the hypothesis you are trying to substantiate. The owner wants to test for an increase. This answer would be correct if the owner wanted to test for a change in either direction.
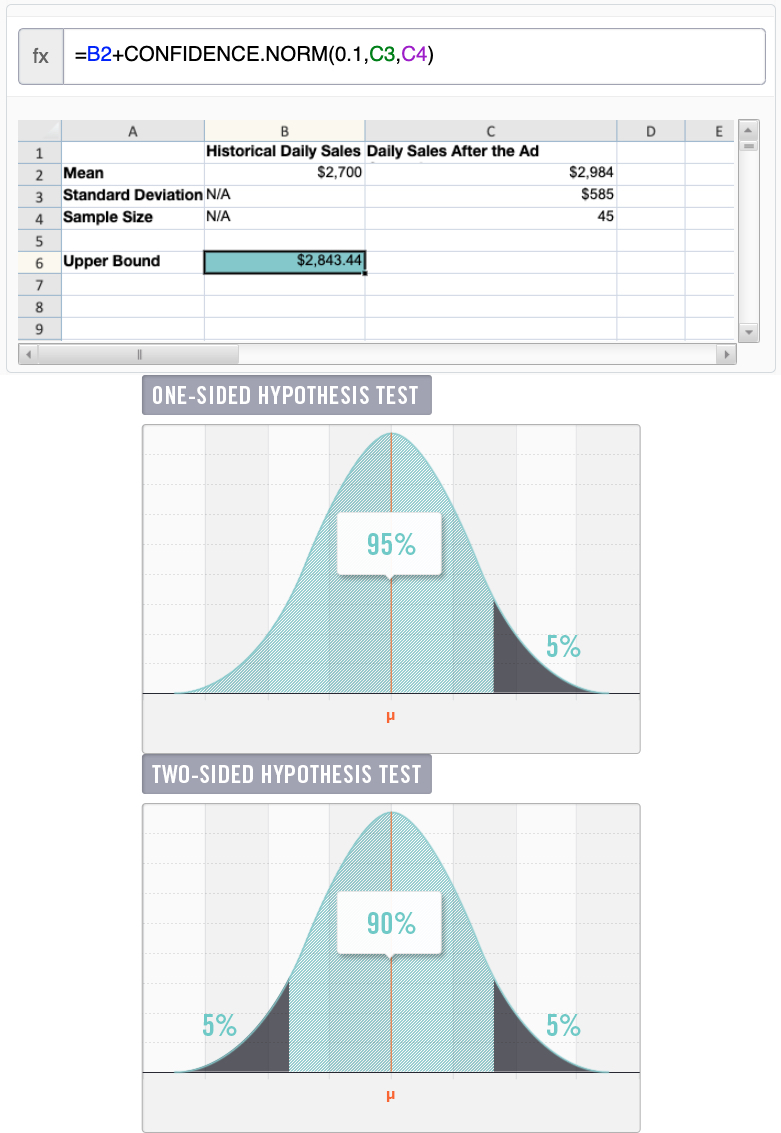
The owner of a local health food store recently started a new ad campaign to attract more business and wants to test whether average daily sales have increased. Historically average daily sales were approximately $2,700. After the ad campaign, the owner took another random sample of forty-five days and found that average daily sales were $2,984 with a standard deviation of approximately $585. Calculate the upper bound of the 95% range of likely sample means for this one-sided hypothesis test using the CONFIDENCE.NORM function.
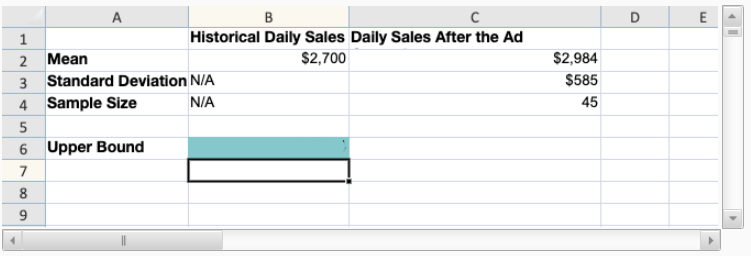
To construct a 95% range of likely sample means, calculate the margin of error using the function CONFIDENCE.NORM(alpha, standard_dev, size). However, CONFIDENCE.NORM finds the margin of error for a two-sided hypothesis test and this question asks for the upper bound of a one-sided test. To find the upper bound for the one-sided test you must first determine what two-sided test would have a 5% rejection region on the right side. Since the distribution of sample means is symmetric, a two-sided test with a 10% significance level would have a 5% rejection region on the left side of the normal distribution and a 5% rejection region on the right side. Thus, the upper bound for a two-sided test with alpha=0.1 will be the same as the upper bound on a one-sided test with alpha=0.05. The margin of error is CONFIDENCE.NORM(alpha, standard_dev, size)= CONFIDENCE.NORM(0.1,C3,C4)=CONFIDENCE.NORM(0.1,585,45)=$143.44. The upper bound of the 95% range of likely sample means for this one-sided hypothesis test is the population mean plus the margin of error, which is approximately $2,700+$143.44=$2,843.44.
Recall that the owner of a local health food store recently started a new ad campaign to attract more business and wants to know if average daily sales have increased. Historically average daily sales were approximately $2,700. The upper bound of the 95% range of likely sample means for this one-sided test is approximately $2,843.44. If the owner took a random sample of forty-five days and found that daily average sales were now $2,984, what can she conclude at the 95% confidence level?
- Average daily sales have increased
- Average daily sales have decreased
- Average daily sales have remained the same
- Average daily sales have not increased
- The answer cannot be determined without further information
Average daily sales have increased
Since the sample mean, $2,984, falls outside the range of likely sample means (which has an upper bound=$2,843.44), the store owner can reject the null hypothesis that μ≤$2,700μ≤$2,700 at a 95% confidence level. Since she can reject the null hypothesis, she can essentially accept the alternative hypothesis and conclude the average daily sales have increased.
Average daily sales have decreased
Since the sample mean falls outside the range of likely sample means (which has an upper bound=$2,843.44), the store owner can reject the null hypothesis that μ≤$2,700μ≤$2,700 at a 95% confidence level. Therefore, she cannot conclude that average daily sales have decreased.
Average daily sales have remained the same
Since the sample mean falls outside the range of likely sample means (which has an upper bound=$2,843.44), the store owner can reject the null hypothesis that μ≤$2,700μ≤$2,700 at a 95% confidence level. Therefore, she cannot conclude that average daily sales have remained the same.
Average daily sales have not increased
Since the sample mean falls outside the range of likely sample means (which has an upper bound=$2,843.44), the store owner can reject the null hypothesis that μ≤$2,700μ≤$2,700 at a 95% confidence level. If the sample mean had fallen in the range of likely sample means, the owner would have failed to reject the null hypothesis and hence would have insufficient evidence to conclude that average daily sales had increased. Either way, she cannot conclude that average daily sales have not increased, as that would be equivalent to accepting the null hypothesis.
The answer cannot be determined without further information
Since you know the upper bound of the 95% range of likely sample means for this one-sided test, and you know the sample mean, there is enough information to answer this question.
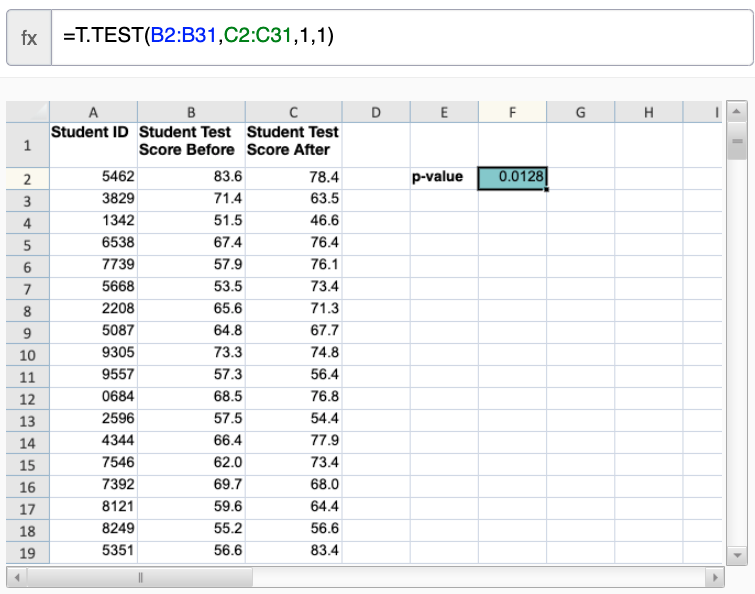
A business school professor is interested to know if watching a video about the Central Limit Theorem helps students understand it. To assess this, the professor tests students’ knowledge both immediately before they watch the video and immediately after. The professor takes a sample of students, and for each one compares their test score after the video to their score before the video. Using the data below, calculate the p-value for the following hypothesis test:
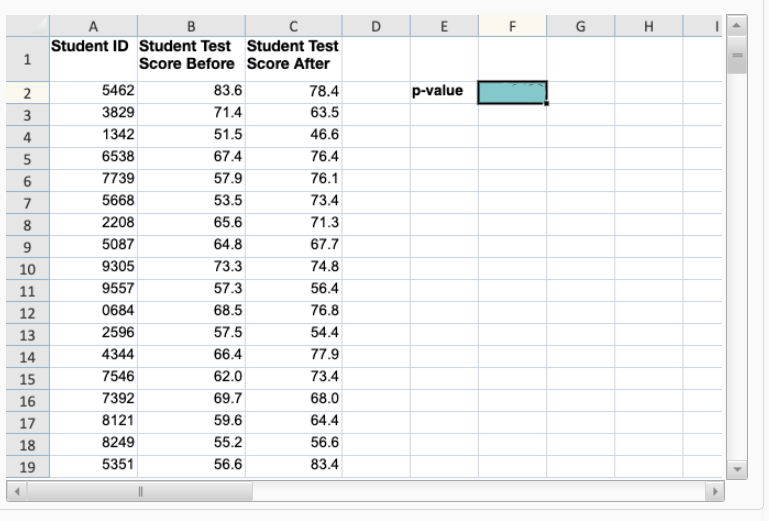
The p-value of the one-sided hypothesis test is T.TEST(array1, array2, tails, type)=T.TEST(B2:B31,C2:C31,1,1), which is approximately 0.0128. You must designate this test as a one-sided test (that is, assign the value 1 to the tails argument) and as a type 1 (a paired test) because you are testing the same students on the same knowledge at two points in time. You must link directly to values in order to obtain the correct answer.
A college student is interested in testing whether business majors or liberal arts majors are better at trivia. The student gives a trivia quiz to a random sample of 30 business majors and finds the sample’s average score is 86. He gives the same quiz to 30 randomly selected liberal arts majors and finds the sample’s average score is 89. What is the alternative hypothesis of this test?
- μBusiness>μLiberal Arts
- μBusiness=μLiberal Arts
- μBusiness≠μLiberal Arts
- μBusiness<μLiberal Arts
μ Business > μLiberal Arts
This would be the alternative hypothesis if the student wanted to test whether business school majors are better at trivia than liberal arts majors.
μ Business = μLiberal Arts
This is the null hypothesis for testing whether business school and liberal arts school majors’ trivia knowledge is different.
μBusiness ≠ μLiberal Arts
The alternative hypothesis is the claim that is being tested. Since the student wants to test whether there is a difference between business school majors’ and liberal arts majors’ trivia scores, the alternative hypothesis is that the mean scores are not equal.
μBusiness < μLiberal Arts
This would be the alternative hypothesis if the student wanted to test whether liberal arts majors do better at trivia than business school majors.
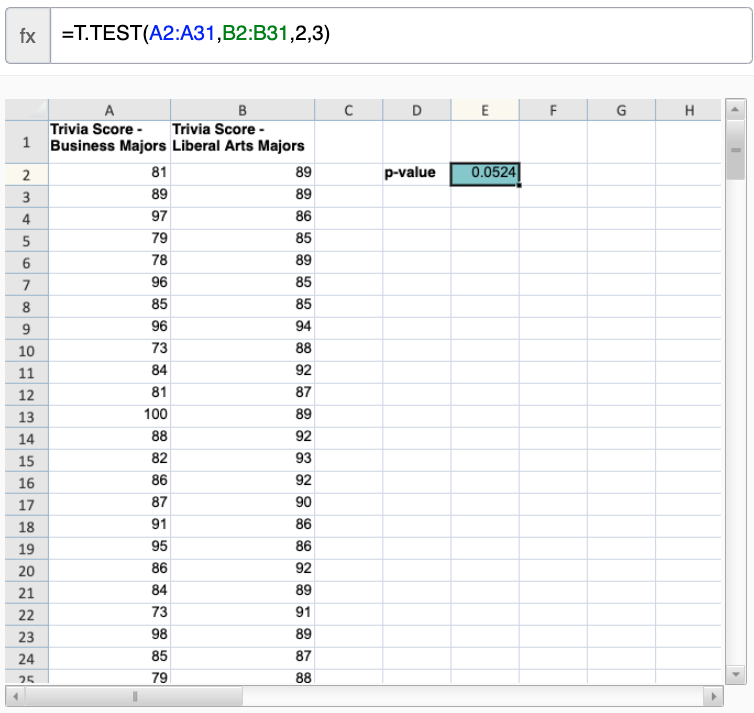
A college student is interested in testing whether business majors or liberal arts majors are better at trivia. The student gives a trivia quiz to a random sample of 30 business school majors and finds the sample’s average score is 86. He gives the same quiz to 30 randomly selected liberal arts majors and finds the sample’s average score is 89. Using the data provided below, calculate the p-value for the following hypothesis test:
- H0: μBusiness = μLiberal Arts
- Ha: μBusiness ≠ μLiberal Arts

The p-value of the two-sided hypothesis test is T.TEST(array1, array2, tails, type)=T.TEST(A2:A31,B2:B31,2,3), which is approximately 0.0524. You must designate this test as a two-sided test (that is, assign the value 2 to the tails argument) and as a type 3 test (an unpaired test with unequal variances) because you are testing two different samples. You must link directly to values in order to obtain the correct answer.
A college student is interested in testing whether business majors or liberal arts majors are better at trivia. The student gives a trivia quiz to a random sample of 30 business school majors and finds the sample’s average test score is 86. He gives the same quiz to 30 randomly selected liberal arts majors and finds the sample’s average quiz score is 89. The student finds that the p-value for the hypothesis test equals approximately 0.0524. What can be concluded at α=5%?
- The student should reject the null hypothesis and conclude that there is insufficient evidence of difference between business and liberal arts majors’ knowledge of trivia.
- The student should reject the null hypothesis and conclude that there is a significant difference between business and liberal arts majors’ knowledge of trivia.
- The student should fail to reject the null hypothesis and conclude that there is insufficient evidence of difference between business and liberal arts majors’ knowledge of trivia.
- The student should fail to reject the null hypothesis and conclude that there is a significant difference between business and liberal arts majors’ knowledge of trivia.
The student should reject the null hypothesis and conclude that there is insufficient evidence of difference between business and liberal arts majors’ knowledge of trivia.
Since the p-value, 0.0524, is greater than the significance level, 0.05, the student should fail to reject the null hypothesis.
The student should reject the null hypothesis and conclude that there is a significant difference between business and liberal arts majors’ knowledge of trivia.
Since the p-value, 0.0524, is greater than the significance level, 0.05, the student should fail to reject the null hypothesis.
The student should fail to reject the null hypothesis and conclude that there is insufficient evidence of difference between business and liberal arts majors’ knowledge of trivia.
Since the p-value, 0.0524, is greater than the significance level, 0.05, the student should fail to reject the null hypothesis and conclude that there is insufficient evidence of difference between business and liberal arts majors’ knowledge of trivia. Because the null hypothesis is that there is no difference between the two types of majors, this answer is correct.
The student should fail to reject the null hypothesis and conclude that there is a significant difference between business and liberal arts majors’ knowledge of trivia.
Since the p-value, 0.0524, is greater than the significance level, 0.05, the student should fail to reject the null hypothesis. However, because the null hypothesis is that there is no difference between the two types of majors, the student should conclude that there is insufficient evidence of difference between business and liberal arts majors’ knowledge of trivia. This answer is incorrect.
Select the p-value(s) at which you would reject the null hypothesis for a two-sided test at the 90% confidence level. SELECT ALL THAT APPLY.
- 0.9500
- 0.9000
- 0.8900
- 0.1100
- 0.0900
- 0.0500
- 0.0250
0.9500
To reject the null hypothesis at the 90% confidence level, the p-value must be less than 1–0.90=0.10. 0.9500 is not less than 0.10 so we cannot reject the null hypothesis.
0.9000
To reject the null hypothesis at the 90% confidence level, the p-value must be less than 1–0.90=0.10. 0.9000 is not less than 0.10 so we cannot reject the null hypothesis.
0.8900
To reject the null hypothesis at the 90% confidence level, the p-value must be less than 1–0.90=0.10. 0.8900 is not less than 0.10 so we cannot reject the null hypothesis.
0.1100
To reject the null hypothesis at the 90% confidence level, the p-value must be less than 1–0.90=0.10. 0.1100 is not less than 0.10 so we cannot reject the null hypothesis.
0.0900
To reject the null hypothesis at the 90% confidence level, the p-value must be less than 1–0.90=0.10. 0.0900 is less than 0.10 so we can reject the null hypothesis.
0.0500
To reject the null hypothesis at the 90% confidence level, the p-value must be less than 1–0.90=0.10. 0.0500 is less than 0.10 so we can reject the null hypothesis.
0.0250
To reject the null hypothesis at the 90% confidence level, the p-value must be less than 1–0.90=0.10. 0.0250 is less than 0.10 so we can reject the null hypothesis.


