Probability Distributions Flashcards
(100 cards)
Probability distribution
A probability distribution lists all the possible outcomes of an experiment, along with their associated probabilities.
Discrete Random Variable
A Discrete Random Variable has positive probabilities associated with a finite number of outcomes.
Continuous Random Variable
A continuous random variable has positive probabilities associated with a range of outcome values–the probability of any single value is zero.
Set of possible outcomes of a specific discrete random variable
Finite set of values (in a discrete distribution, p(x)=0 if it cannot happened, and p(x)>0 if it can).
Probability Function
P(X=x) = p(x), such that 0<=1 and Σp(x)=1
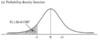
Probability Density Function (pdf)
Function for a continuous random variable used to determine the probability it will fall in a particular range

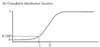
Cumulative Distribution Function (cdf)
Discrete Uniform Distribution
Distribution where there are n discrete, equally likely outcomes.
Binomial Distribution
Probability distribution for a binomial (discrete) random variable that has two possible outcomes.
Probability of an outcome under a discrete uniform distribution
1/n
Probability of an outcome under binomial distribution (with p = probability of success)

Binomial tree
Illustrates the probabilities of all the possible values that a varaible can take on given the probability of an up-move and the magnitude of an up-move

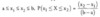
Continuous Uniform Distribution
The probability of X occuring in a possible range is the length of the range relative to the total of all possible values. If a and b are the limits, then:
Normal Probability distribution
1) it is symmetrical and bell-shaped with a peak in the center
2) mean = median = mode,
3) the normal distribution is defined by the
mean and standard deviation; skew = 0; kurtosis = 3

Multivariate Distribution
Describes the probabilities for more than one random variable
Univariate Distribution
Describes the probabilities for a single random variable
Confidence interval
The range within which we have a given level of confidence of finding a point estimate
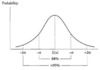
90% confidence interval
μ +/- 1.65 standard deviations
95% confidence interval
μ +/- 1.96 standard deviations
99% confidence interval
μ +/- 2.58 standard deviations
Probability that a normally distributed random variable X will be within A standard deviations of its mean
Twice the cumulative left-hand tail probability F(-A), where F(A) is the cumulative standard normal probability of A
z-table
Used to find the probability that X will be less than or equal to a given value
P(X<>
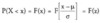
P(X>x)