Public Health Sciences - First Aid Flashcards
(167 cards)
Observational Studies:
- frequency of disease and frequency of risk-related factors are assessed in the present
- “What is happening?”
- disease prevalence
- can show risk factor association with disease, but does not establish causality
Cross-Sectional Study
Observational Studies:
- compares a group of people with disease to a group without disease.
- looks to see if odds of prior exposure or risk factor differs by disease state
- “What happened?”
- Odds Ratio (OR)
Case-Control Study
Observational Studies:
- compares a group with a given exposure or risk factor to a group without such exposure
- looks to see if exposure or risk factor is associated with later development of disease
- Prospective—“Who will develop disease?”
- Retrospective—“Who developed the disease [exposed vs. nonexposed]?”
- Relative Risk (RR)
Cohort Study
Observational Studies:
- compares the frequency with which both monozygotic twins vs. both dizygotic twins develop the same disease
- measures heritability and influence of environmental factors (“nature vs. nurture”)
Twin Concordance Study
Observational Studies:
- compares siblings raised by biological vs. adoptive parents
- measures heritability and influence of environmental factors
Adoption Study
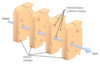
A _____ is an experimental study involving humans. Compares therapeutic benefits of 2 or more treatments, or of treatment and placebo.
Clinical Trial
Study quality improves when the study is randomized, controlled, and _____ (ie. neither patient nor doctor knows whether the patient is in the treatment or control group).
Double-Blinded
_____ refers to the additional blinding of the researchers analyzing the data.
Triple-Blind
Four Phases of Clinical Trials
“Does the drug SWIM?
- Is it Safe?
- Does it Work?
- Any Improvement?
- Can it stay in the Market?
Phases of Clinical Trials:
- small number of healthy volunteers or patients with disease of interest
- “Is it safe?”
- assesses safety, toxicity, pharmacokinetics, and pharmacodynamics
Phase I
Phases of Clinical Trials:
- moderate number of patients with disease of interest
- “Does it work?”
- assesses treatment efficacy, optimal dosing, and adverse effects
Phase II
Phases of Clinical Trials:
- large number of patients randomly assigned either to the treatment under investigation or to the best available treatment (or placebo)
- “Is it as good or better?”
- compares the new treatment to the current standard of care
Phase III
Phases of Clinical Trials:
- postmarketing surveillance of patients after treatment is approved
- “Can it stay?”
- detects rare or long-term adverse effects
- can result in treatment being withdrawn from market
Phase IV
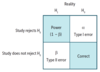
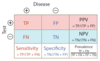
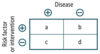
Evaluation of Diagnostic Tests
- Uses 2 × 2 table comparing test results with the actual presence of disease.
- Sensitivity and specificity are fixed properties of a test. PPV and NPV vary depending on disease prevalence in population being tested.

Evaluation of Diagnostic Tests:
- proportion of all people with disease who test positive, or the probability that when the disease is present, the test is positive
- value approaching 100% is desirable for ruling out disease and indicates a low false-negative rate
- used for screening in diseases with low prevalence
Sensitivity (True-Positive Rate)
- Sn = TP / (TP + FN)
- Sn = 1 – FN rate
- SN-N-OUT = highly SeNsitive test, when Negative, rules OUT disease
- if sensitivity is 100%, then FN is zero
- all negatives must be TNs

Evaluation of Diagnostic Tests:
- proportion of all people without disease who test negative, or the probability that when the disease is absent, the test is negative
- value approaching 100% is desirable for ruling in disease and indicates a low false-positive rate
- used for confirmation after a positive screening test
Specificity (True-Negative Rate)
- Sp = TN / (TN + FP)
- Sp = 1 – FP rate
- SP-P-IN = highly SPecific test, when Positive, rules IN disease
- if specificity is 100%, then FP is zero
- all positives must be TPs

Evaluation of Diagnostic Tests:
probability that a person who has a positive test result actually has the disease
Positive Predictive Value
- PPV = TP / (TP + FP)
- PPV varies directly with pretest probability (baseline risk, such as prevalence of disease)
- high pretest probability → high PPV

Evaluation of Diagnostic Tests:
probability that a person with a negative test result actually does not have the disease
Negative Predictive Value
- NPV = TN / (TN + FN)
- NPV varies inversely with prevalence or pretest probability
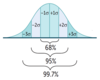
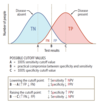
Possible Cutoff Values
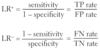
_____ is the likelihood that a given test result would be expected in a patient with the target disorder compared to the likelihood that the same result would be expected in a patient without the target disorder.
Likelihood Ratio
- LR+ > 10 and/or LR– < 0.1 indicate a very useful diagnostic test
- LRs can be multiplied with pretest odds of disease to estimate posttest odds
Quantifying Risk
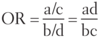
Definitions and formulas are based on the classic 2 × 2 or contingency table.

Quantifying Risk:
- typically used in case-control studies
- depicts the odds of a certain exposure given an event (eg. disease; a/c) vs. the odds of exposure in the absence of that event (eg. no disease; b/d)

Odds Ratio
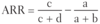
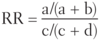
Quantifying Risk:
- typically used in cohort studies
- risk of developing disease in the exposed group divided by risk in the unexposed group (eg. if 5/10 people exposed to radiation get cancer, and 1/10 people not exposed to radiation get cancer, the _____ is 5, indicating a 5 times greater risk of cancer in the exposed than unexposed)
- for rare diseases (low prevalence), OR approximates _____.
Relative Risk
- RR = 1 → no association between exposure and disease
- RR > 1 → exposure associated with ↑ disease occurrence
- RR < 1 → exposure associated with ↓ disease occurrence
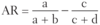
Quantifying Risk:
the difference in risk between exposed and unexposed groups (eg. if risk of lung cancer in smokers is 21% and risk in nonsmokers is 1%, then the attributable risk is 20%)

Attributable Risk