Required rate of return/interest rate

Future Value

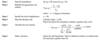
Calculating stated (nominal) and effective rates from periodic

Computing effective rates from periodic rate

Future value formula with more than one compounding period

FV/PV based on continuous compounding

PV of a perpetuity

Annuity Due
Payments paid at the beginning of period
Ordinary annuity
Cash flows made at the end of each period
Nominal Scale (4th strongest)
Data is only categorized
Ordinal Scale (3rd Strongest)
Data is categorized and ranked
Interval Scales (2nd Strongest)
Data is categorised, ranked, and evenly spaced
Ratio scales (1st Strongest)
Strongest level of measurement. Categorized, ranked, evenly spaced, natural zero
Steps to producing frequnecy distribution
- Sort data into ascending order
- Calculate range of data
- Decide on number of intervals (k) and interval width (Range/k)
- Determine intervals by successively adding width to minimum value
- Count number observations falling in each interval
- Construct a table showing number of observations falling into each interval
Cumulative frequency
Absoluted frequencies added up as we move from first to last interval
Relative frequency
Absolute frequency of each interval divided by total number of observations
Cumulative relative frequency
Adds up relative frequencies as we move from first to last interval. Fraction of observations that are less than upper limit of each interval
Histogram
Graphical presentation of absolute frequency distribution
Frequency Polygon
Graph midpoint of each interval on horizontal axis and absolute frequency on vertical; draw a line graph
Geometric mean

Mean absolute deviation

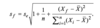
Variance

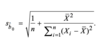
Standard deviation/Varaince calculator

Quartile calculation


-
Ethics44
-
Quantitative Methods 160
-
Quantitative Methods 236
-
Financial, Reporting and Analysis88
-
Equity Investments & FI124
-
Corporate Finance, Derivatives, PM, Alternative Investments59
-
Credit Ratings13
-
Portfolio Management: Technical Analysis42
-
Portfolio Management: Intro to Risk Management27
-
Portfolio Management: Planning and Construction22
-
Portfolio Management: Portfolio Risk & Return32
-
Quant Common Probability Distributions43
-
Economics: Business Cycles72
-
Economics: Microeconomics56
-
Economics: Macroeconomics46
-
Economics: Market Structure26
-
Economics: International Trade37
-
Economics: Monetary and Fiscal Policy58
-
FR&A - Balance Sheets9
-
Accounting : IS's54
-
FR&A Long-Lived Assets9
-
Corporate Finance: Working Capital Mgmt42
-
Equity: Market Structure99
-
Fixed Income: Markets, Issuance, Trading, and Funding58
-
Fixed Income: Fundamentals of credit analysis33
-
Fixed Income: Intro to Asset Backed Securities36
-
Volume 1: Asset Allocation (key words)0
