R4 - Quant - Introduction To Linear Regression Flashcards
(22 cards)
The 6 Assumptions of the Linear Regression Model
1) The relationship between the dependent variable Y, and the independent variable X is linear in the parameters b0 and b1. This requirement means that b0 and b1 are raised to their first power only and that neither b0 nor b1 is multiplied or divided by another regression parameter (as in b0/b1) The requirement does not exclude X from being raised to a power other than 1
2) The independent variable X is not random
3) The expected value of the error term is 0
4) The variance of the error term is the same for all observations.
5) The error term E is uncorrelated across observations. Consequently E(ei ej) = 0 for all i that are not equal to j)
►6) The error term, E, is normally distributed.
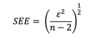
SEE
(Standard Error of Estimate)
This is the standard deviation of the distribution of the Error Term
The smaller the SEE the more acurate the regression
B0 & b1 are estimated so we lose 2 degrees of freedom hence having n -2
Error Term
The portion of the dependent variable that is not explained by the independent variable(s) in the regression.
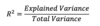
R2
Coefficient of Determination
(Single Independent Variable)
Measures the fraction of the total variation in the DV that is explained by the IV
if Only 1 IV square the correlation between DV & IV
r = PXY =
Thus if r = .9203 then r2 = 0.8470
Thus the IV explains 84.7% of the variation in Y
R2
Coefficient of Determination
(Multiple Independent Variable)
Measures the fraction of the total variation in the DV that is explained by the IV
R2 = 1 -

Confidence Invterval for a regression coefficient
An interval of values that is believed to include the true parameter value of b1 with a given degree of confidence.
Smaller Standard Deviation = tighter confidence Interval

Hypothesis Testing
Level 2 only does T statistics
=
T = Test statisitic (Typically tested at µ = 5%
At this level the critical value is 1.96
Therefore anything with a T- Statistic of less than 1.96 can be rejected.
Dependent Variable
The variable whose variation around the mean is to be explained by the regression.
The left hand side variable in a regression equation.
Usually called Y
y=f(x)
Independent Variable
A variable used to explain the dependent variable in a regression;
a right-hand-side variable in a regression equation.
Usually called X
y=f(x)
P Value
The smallest level of significance at which the null value can be rejected
SSE
Sum of Squared Errors or residuals
Also known as residual sum of Squares
(The Unexplained)
RSS
Regression Sum of Squares
This value is the amount of total variation in Y that is explained in the regression equation.
(The Explained)
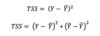
TSS
Total Sum of the Squares
TSS = SSE + RSS
TSS = The Unxplained + The Explained
(SSE) (RSS)
ANOVA
ANalysis Of VAriance
Determine the usefulness of the IVs in explaining the variance in the DV
ANOVA provides the inputs for an F-Test of the sig
Estimated parameters
With reference to a regression analysis, the estimated values of the population intercept and population slope coefficient(s) in a regression.
Fitted parameters
With reference to a regression analysis, the estimated values of the population intercept and population slope coefficient(s) in a regression.
Linear regression
Regression that models the straight-line relationship between the dependent and independent variable(s).
Regression coefficients
The intercept and slope coefficient(s) of a regression.
ANOVA F Statistic
(3) Limitations of Linear Regression
- Regression relations can change over time
e.g. Parameter instability
Sensitive to:
- Time Period Selected
- Sampling from more than 1 population - What works only works if it is kept secret
- Public knowledge may negate usefulness - Output dependent on regression assumptions
- tests can be performed on the €
- typically not unequivocal
Parameter instability
The problem or issue of population regression parameters that have changed over time.
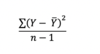
Sample Variance
of the Dependent Variable
or