Regression Flashcards
Lines and shit (26 cards)
What is the
Naive/Baseline Prediction
and why is it important to have one?
A Naive/Baseline Prediction is generally the simplest possible prediction you can make with your Data if you want to generate the same predicted y values for all your observations – generally this prediction is the mean of your y values, 𝑦¯ . A baseline prediction is important to have because it gives you a basis of comparison for your future predictions/models.

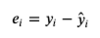
What are
residuals/errors
and how are they calculated?
Residuals/Errors are the difference between the true value of y and the predicted value of y.
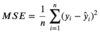
What is the
Mean Squared Error
and why do we utilize it?
The MSE measures the average of the squares of our residuals/errors. In short, it is the average squared distance between the estimated values and what is estimated. Also known as a Loss Function, the MSE is a helpful way to measure how good or bad a model is. The MSE is always non-negative, and the closer to 0 it is, the better.

How might we
minimize
our
MSE/SSE/RSE
For Simple Linear Regression?
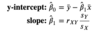
- One can minimize their MSE/SSE/RSE by algebraically calculating their y-intercept and slope. To do this they need
- 𝑦¯ and 𝑥¯: the sample means of observed y and x values
- 𝑠𝑌 and 𝑠𝑋: the sample standard deviations of observed y and x values
- 𝑟𝑋𝑌: the sample pearson correlation coefficient between observed x and y.
- With these values, one can calculate Beta0 and Beta 1 with the attached equation.
- beta_1= 𝑟𝑋𝑌 * 𝑠𝑌 / 𝑠𝑋
- Another way of doing this:
model.intercept_after fitting your model in Python
- Another way of doing this:
- beta_0 = 𝑦¯ - beta_1 * 𝑥¯
- Another way of doing this: ‘model.coef_` after fitting your model in Python.
- beta_1= 𝑟𝑋𝑌 * 𝑠𝑌 / 𝑠𝑋
What is the main Python library we will be using for
Machine Learning?
What other python libraries might we use for modeling?
Sklearn/Scikit-Learn for machine learning.
We can also use statsmodels in the context of regression modeling – although this package is generally used for statistical modeling.
In general, we use machine learning for prediction and statistics for inference.
What does it mean to
Fit
a model?
When we fit a model, we are estimating the parameters of the model with our data. The process of fitting our model means to calculate the values of β^0(BetaHat0) and β^1(BetaHat1): our best guesses for what their true values are.
What are the 4 steps for building a Linear Regression model?
- Instantiate model:
model = LinearRegression() - Fit model to the data:
model.fit(X, y) - Generate predictions. (optional):
y_pred = model.predict(X) - Evaluate model:
MSE(Y , y_pred)
What does it mean to
Make Predictions
from a model?
Making predictions from a model is when we take an observation’s x values and plug those values into their corresponding slots in the equation below (EG X1 will go with B1, X2 with B2, etc.). Once everything to the right of the equals sign is a number, add and multiply those as they’re written to get the predicted value.

What are the
4 Assumptions
of SLR
Are they the same for MLR?
LINE
- Linearity
- Y and X must have an approximately linear relationship.
- Independence of Errors
- Errors (residuals) ei and ej must be independent of one another for any 𝑖≠𝑗i≠j.
- Normality
- The errors (residuals) follow a Normal distribution with mean 0.
- Equality of Variances (Homoscedasticity of errors)
- The errors (residuals) should have a roughly consistent pattern, regardless of the value of X. (There should be no discernable relationship between X and the residuals.)
-
MLR has one more rule:
- Independence of Predictors
- (almost always violated at least a little!): The independent variables 𝑋𝑘 and 𝑋𝑙 must be independent of one another for any 𝑘≠𝑙k≠l.
- Independence of Predictors
Do you want your Residuals to have a normal distribution? Why or why not?
Yes, you do want your residuals to have a normal distribution. If there is a consistant variance between low and high predictions, that means your residuals have scedasticity. If they do not, your target is heteroscedastic and should probably be run through a ‘power transformer’.
What is
MAE

-
Mean Absolute Error.
- np.abs(residuals).mean(), OR
- metrics.mean_absolute_error(y, predictions)
- Ideally, you want your MAE to be as close to 0 as possible
- Pros
- Represents median distance from the predicted value.
- In the original units of Y.
- Is not heavily affected by outliers.
- Cons
- Depends on scale of Y. (i.e. housing prices vs. GPA)
What is
RSS
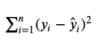
-
Residual Sum of Squares
- rss = (residuals ** 2).sum()
- RSS forms the basis of many other regression metrics
- MSE
- RMSE
- R2
What is
MSE
-
Mean Squared Error
- rss / len(predictions)
- metrics.mean_squared_error(y, predictions)
- Ideally MSE will be as close to 0
- Pros
- Very common; part of other calculations
- Represents average distance squared from the predicted value.
- Con
- Can be heavily affected by outliers.
- Not in the original units of 𝑌Y.
- Depends on scale of 𝑌Y. (i.e. housing prices vs. GPA)
What is
RMSE
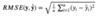
-
Root Mean Squared Error
- np.sqrt(rss / len(predictions))
- Ideally RMSE will be as close to 0 as possible
- Pros
- Pretty common; part of other equations
- Represents (approximately) average distance from the predicted value.
- In the original units of Y.
- Cons
- Can be heavily affected by outliers
- Depends on scale of 𝑌Y. (i.e. housing prices vs. GPA)
What is the Coefficient of Determination?
or 𝑅²?

- Your R² score determines how accurate your model is. The closer to 1, the better
- metrics.r2_score(y, predictions)
- Pros
- Easy interpretation
- Common Metric
- Does not depent on scale of Y
- Works with more than just linear regression
- Cons
- As you add more variables, 𝑅2R2 will never decrease (with linear regression). Adjusted R2 can handle this assumption better.
What is Bias?
Bias is how bad your model is at predicting Y, the average difference between our model 𝑦̂ and the truth y. A high bias model is classified as Unferfit
What is Variance?
Variance is how bad your model is at generalizing to new data. A high variance model is classified as Overfit
What are some common strategies for dealing with bias and variance?
- Get more data
- Get a better sample of data
- Increase complexity of model
- Decrease complexity of model
- Regularize
The goal with modelling is to generalize our estimations well.
What does
σ2
represent in the context of bias/variance and regression?
- Irreducable error
- Error that cannot be reduced by model improvement.
- Error due to randomness or natural variability in an existing system.
What is a
Train/Test Split
and why do we do them?
- A train/test split is when we split our data into two pieces, a training set that we fit our model onto, and a testing set that will be used to evaluate the quality of predictions.
- X_train, X_test, y_train, y_test = train_test_split(X, y, random_state=[num])
- We do these so we can validate our model’s ability to generalize new data.
- Train/Test splits also help us diagnose whether or not our model is overfitted.
What is
Feature Engineering?
- Feature engineering is the term broadly applied to the creation and manipulation of features (variables) used in machine learning algorithms.
The Process of Feature Engineering
- Brainstorming or testing features
- Deciding which features to create
- Creating Features
- Checking how the features work with your model
- Improving Features (if needed).
- Return to step 1
- “Do Data Science!”
What is
K-Fold Cross Validation
and why do we use it?
- K-Fold Cross Validation takes the idea of a single train/test split and expands it across multiple tests across different train/test splits of your data (different samples)
- cross_val_score()
- you can also call .mean() on this method to get the average score of all your testing sets.
- cross_val_score()
- We do this because it helps us understand how a model will perform in multiple different cases.
What are
Interaction Terms?
- In regression, interaction terms allow us to see what affect the combination of two features have on our label.
- df[‘Interaction Col’] = df[‘Column 1’] * df[‘Column 2’]
How would we create
Interaction Terms in masse?
- The quickest way to do this is through the use of sklearn’s PolynomialFeatures ‘function’.
- How to do this
- First, instantiate:
poly = PolynomialFeatures(include_bias=False) - Second, create X-Poly :
X_poly = poly.fit_transform(X)
- First, instantiate:
