Chapter 6-8 Test Prep Flashcards
Backing into σ for confidence intervals
if you assume a normal distribution, the range is approximately equal to 6σ (± 3σ) so that you estimate σ as the range divided by 6
Central Limit Theorem
As the sample size gets large enough, the sampling distribution of the mean is approximately normally distributed. This is true regardless of the shape of the distribution of hte individual values in the population.
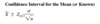
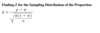
Confidence Interval Estimate for the Proportion
where
p = sample proportion = X/n
π = population proportion
Zα/2 = critical value from the standardized normal distribution
n = sample size

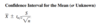
Confidence Interval Estimate of the Mean
(1- α)*100%
99% confidence interval would be
(1 - α)*100% = 99% > (1 - α) = .99 > 1 - .01 = α > α = .01
Find 1 - α/2 to get the area under the curve for 99%
then find Zα/2 = Z0.005 >
Confidence Interval for the Mean (σ unknown)
where
tα/2 is the critical value corresponding to an upper-tail probability of α/2 from the t distribution with n - 1 degrees of freedom
Confidence Interval for the Mean (σ known)
This is essentially a “known probability” (which is for a population) but for a sample.
i.e. you’re substituting x̄ for µ
cumulative standardized normal distribution
Represents area under the cumulative standardized normal distribution from -∞ to Z
D.C.O.V.A.
Define the data that you want to study to solve a problem or meet an objective
Collect the data from appropriate sources
Organize the data collected, by developing tables
Visualize the data collected, by devleoping charts
Analyze the data collected, to reach conclusions and present those results
Degrees of Freedom
n - 1
exponential distribution
Contains values from zero to positive infinity and is right-skewed, making the mean greater than the median
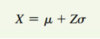
Finding an X Value Associated w/ a Known Probability
X = µ + Zσ
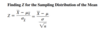
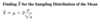
Finding Z for the Sampling Distribution of the Mean
Finding how a sample mean, x̅, differs from the population mean. By substituting x̅ for x, µx̅ for µ, and σx̅ for σ in the equation for finding Z, you get the following:
Finding Z for the Sampling Distribution of the Proportion
Finding x̄ for the Sampling Distribution of the Mean
To find the interval that contains a specific proportion of the sample means.
Note:
Instead of X = µ + σ (i.e. the standard deviation) you use X̅ = µ + Z*σ/sqrt-n (standard error of the mean)
Level of Confidence
is symbolized by (1 - α) * 100%, where
α is the proportion in the tails of the distribution that is outside the confidence interval
Normal Probability Density Function
A probability density function for a specific continuous probability distribution defines the distribution of the values for a continuous variable and can be used as the basis for calculations that determine the likelihood or probability that a value will be within a certian range

Population Mean

Population Standard Deviation
The Standard Deviation is a measure of how spread out numbers are.

Sample Proportion
It is the proportion of items in the sample with the characteristics of interest
The sample proportion, p, will be b/t 0 & 1.

Sample Size Determination for the Mean
To compute the Sample Size, you must know three quantities:
- The desired confidence level, which determines the value of Zα/2, the critical value from the standardized normal distribution
- The acceptable sampling error, e
- The standard deviation, σ

Standard Error of the Mean
The value of the standard deviation of all possible sample means, called the standard error of the mean, expresses how the sample means vary from sample to sample.

Standard Error of the Proportion
The statistic p is an unbiased estimator of the population proportion, π

By analogy to the sampling distribution of the mean, whose standard error is σX̅ = σ/sqrt-n, the
STANDARD ERROR OF THE PROPORTION IS
Z Transformation Formula
The transformation formula computes a Z value that expresses the difference of the X value from the mean, µ, in standard deviation units called standardized units.
Then you can determine the probabilities by using the cumulative standardized normal distribution table.
The Z value is equal to the difference between X and the mean, µ, divided by the standard deviation, σ.
