Chapter 9 Flashcards
What is Hypothesis Testing
Hypothesis testing is a methodology to test a theory, claim, or an assertion about a particular parameter of a population.
- You reject H0 when the sample evidence suggests that it is far more likely that H1 is true.
- Failure to reject H0 is not proof that it is true. You can never prove that is H0 correct b/c the decision is based on sample information, not the entire population
Null Hypothesis
The null hypothesis (H0)
- typically represents the status quo
- stated in terms of the population parameter (e.g. μ, not x̄)
- uses a sample statistic to make inferences about the population parameter
- if you reject H0, you have proof that H1 is true
- if you do not reject H0, it does not mean you’ve proved it.
- Always contains an equal sign
Proper phrasing of accepting H0: “there is insufficient evidence to reject H0”
Alternative Hypothesis
H1
The alternative hypothesis
- is the opposite of H0
- represents the conclusion reached by rejecting H0
- represents a research claim or specific inference you would like to prove
- H1 never has an equal sign
What is Hypothesis Testing
- Uses a test statistic based on a given sample result
- provides clear definitions for evaluating differences
- enables you to quantify the decision-making process by computing the probability of getting a certain sample result if the H0 is true
What is the test statistic
Identified by STAT
A statistic computed from a given sample and tested against the sampling distribution for the sample statistic of interest.
If it falls within the Region of Nonrejection, then H0 cannot by rejecte
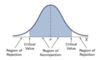
What are the Regions of Rejection and Nonrejection
The region of rejection (also “critical region”) consists of values of the test statistic (e.g. ZSTAT) that are unlikely to occur if H0 is true, and thus indicate you should reject H0
The region of nonrejection consists of values of the test statistic that indicate H1 is true and you cannot reject H0.
What is Type I Error
A Type 1 error (TIe) - if you reject H0 when it is true
- The probability of a TIe occurring is α
- α is the level of significance of committing a TIe
- The confidence coefficient, (1 - α), is the probability you will not reject H0 whien it should not be rejected
- Decreasing α decreases the chance of a TIe, but increases the chance of a TIIe. Use this when you want to be very confident of not making a TIe.
What is a Type II Error
A Type II error (TIIe) - if you don’t reject H0 when it is false
- The probability of a TIIe occurring is β
- β is the risk of committing a TIIe
- The ower of a statistical test, (1 - β), is the probability that you will reject H0 when it should be rejected
- Decreasing β decreases the chance of a TIIe, but increases the chance of a TIe. Use this when you want to be very confident of not making a TIIe.
Hypothesis Testing and Decision Making (Review Table)

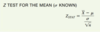
Describe the Z Test for the Mean (σ Known)
The Z Test defines the ZSTAT for determing the difference between the x̄ and the μ
- Note: it is rare that the σ is known
- You must assume standard distribution
Z Test Equation:
Define the Critical Value Approach to Hypothesis Testing
Compares the value of the computed ZSTAT test statistic to critical values that divide the normal distribution into regions of rejection and nonrejection
Critical Values are expressed as standardized Z values determined by the level of significance (α)
- .1: ± 1.645
- .05: ± 1.96
- .01: ± 2.575
Define a two-tail test
When H0 contains an ‘=’ sign, the region of rejection is divided into 2 parts.
- α is ÷’d by 2
- a rejection region is located below the critical value and above the critical value
Define the 6 Steps of the Critical Value Approach to Hypothesis Testing
- State the null hypothesis, H0, and the alternative hypothesis, H1.
- Choose the level of significance, α, and the sample size, n. (This is based on the relative importance of the risk of committing TIe and TIIe in the problem)
- Determine the appropriate test statistic and sampling distribution
- Determine the critical values that divide the rejection and nonrejection regions
-
:
- Collect the sample data,
- organize the results, and
- compute the value of the test statistic
-
:
- Make the statistical decision,
- determine whether the assumptions are valid, and
-
state the managerial conclusion in the context of the theory, claim, or assertion being tested
- If the test statistic falls into the nonrejection region, you do not reject H0
- If the test statistic falls into the rejection region, you reject H0
p-Value Approach to Hypothesis Testing
What are the decision rules for rejecting H0 in the p-value approach
Z Test for the Proportion
To test a hypotheses about the proportion of events of interest in the population, π, rather than test the population mean, μ.
Compute the sample proportion, p = X/n. Then compare this to the hypothesized value of the parameter π
ZSTAT = (p - π) / sqrt(π(1 - π))/n
Note: confirm that X and (n - X) are each at least 5. This confirms that the sampling distribution of a proportion approximately follows a normal distribution.
