L12 - Panel Data Econometrics Flashcards
How do we represent Panel Data models as a linear equation?

What are the Linear Unobserved Effects Panel Data Models?
- unobserved heterogeneity latent heterogeneity –> assuming constant over time

What are the different types of Panel Data we will be looking at?
- Pooled Model
- Individual and Time Dummies
- Fixed Effects Model
- Random Effects Model
What is a Pooled Model?
- if there is no correlation between unobserved effects and our explanatory variable –> you can just run OLS
- Observations for the same cross-sectional unit will be correlated with each other (similar for individuals than across them)

What are the two types of Unobserved Effects models?
- Most common panel econometric technique that is used in the world –> always be unobserved effects
- If unobserved heteroexogenity is not correlated with the explanatory variables ==> use random effects model
- If it is –> used fixed effect model

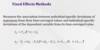
What is the Fixed Effects methods transformation?
- Takes the value of the dependent variable for each individual and averages them over time and subtracts that from each value of y
- Average individual y over total period
- Same transformation with the error term
- What happens to the unobserved variables?
- As they are constant over time, their average is constant and thus is cancelled out when you do the subtraction of the time averaged dependent variable
- PROBLEM:
- If variables do not vary across time e.g. gender –> they will end up being dropped out of the model
What is the Random Effects model transformation?
- If they are uncorrelated with the explanatory variable you can just put the unobserved heterogeneity in the error term
- This will cause the error terms for an individual to be correlated across time

What is the variance-covariance matrix for the Random effects model?
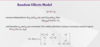
What is the Generalised Least Squares (GLS) Estimator?

How do you decide whether you use a Fixed effects or Random effects model?
- If they arent correlated with the regressors –> used random effects model as it is more efficient
- Null: no correlated between unobserved values and the explanatory variable
- If critical value > Chi-squared statistics
- Or P-Value is less than 0.05
- Reject the Null –> conclude that betas across different models are differemt and there is correlation between the variables
- If critical value > Chi-squared statistics

What is the difference between a balanced and unbalanced panel?
- balanced
- Have data for all individuals for every time period
- unbalanced
- Have data for all individuals but may be incomplete e.g. one firm’s data may span the whole 14 year data set whereas another may only span 7 years
What do you have to do in Stata when dealing with panel data?
- Let it know you are dealing with panel data!
- Otherwise, it will treat each cross-sectional unit as if they are unrelated
- STATA COMMAND FOR THIS DATA SET:
- tsset firm fyear, yearly
- panel variable: firm (unbalanced)
- time variable: fyear, 1998 to 2014, but with gaps
- delta: 1 year

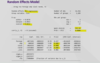
What can we conclude from the Random Effects model Stata output?
- We assume there is no correlation between the unobserved effects and the explanatory variables as part of this model
- But they are contained in the error term, so we are actually causing correlation in the error terms of the same cross-sectional unit across time –> that why we use GLS estimator rather than OLS
- Wald test is the same as the F-test
- null hypothesis that all the individuals are jointly statistically insignificant
-
R-squared can be interpreted as normal for these model
- 6.52% of the variation in the data is explained by the four explanatory variables
- sigma_u –> standard deviation with groups
- Sigma_e –> standard deviation overall
- rho –> proportion of variance of the error term due to intraclass correlation of error terms
- RESULTS:
- can interpret the direction of effects
- data isn’t logged so we are looking at unit changes
- So if employment increased by 1000 employees Return-on-Asset would increase by 0.000345 unit
- IF DATA WAS LOG-LOG –> UNLIKE linear models, the panel data interpretation changes
- Don’t need to time anything by 100 for a percentage
- So if employment increased by 1%, Return-on-Asset would increase by 0.000345%
-
LOG-UNIT (dependent is only logged)
-
Coefficients now need to be multiplied by 100
- So if employment increased by 1000, Return-on-Asset would increase by 0.0345%
-
Coefficients now need to be multiplied by 100
-
UNIT-LOG (only explanatory is logged ([percentage change on unit changed)
-
Coefficients need to be divided by 100
- So if employment increased by 1%, Return-on-Asset would increase by 0.00000345%
-
Coefficients need to be divided by 100
What can we conclude from the Fixed Effects model Stata output?
- Very similar interpretation to the random effects
- one thing to note is the difference in beta between the random and fixed models
- If the coefficients are similar –> there is an indication that there is no correlation between the unobserved effects and the explanatory variables
- If they differ largely there is an indication of correlation –> and only the fixed effect will produce reliable estimates
- How close do they need to be aligned? If they are wildly different its obvious if they are close they use Hausman test to establish if they are
- one thing to note is the difference in beta between the random and fixed models
- Fixed Effect uses a F-test (same as Wald really) –> in this case jointly statistically significant

Example of Hausman test to choice between two models?
- Hausman test looks at the statistically significant coefficient between the two models and groups them
- And test if the difference between them is statistically significant
- Null: is the difference between the coefficient is not systematic
- If is it not rejected, it is concluded that the difference between the coefficient is very similar –> we can conclude there is not a correlation between the explanatory variables and the unobserved effects
- Meaning both models produces consistent estimates
- But as the random effect model is more efficient, it should be chosen
- If the null is rejected, the correlation exist and only the fixed effect model will produce consistent estimates