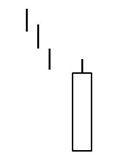
Bullish Belt Hold Line
A bullish belt-hold is a tall white candlestick that opens on, or near, its low and closes well above the opening price. It is also called a white opening shaven bottom.
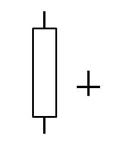
Hammer
An important bottoming candlestick charting pattern. The hammer and the hanging man are both the same lines that are generally called umbrella lines; that is, a small real body (white or black) at the top of the session’s range and a very long lower shadow with little or no upper shadow. When this line appears during a downtrend, it becomes a bullish hammer. For a classic hammer, the lower shadow should be at least twice the height of the real body when candlestick trading.
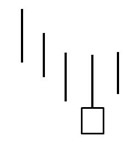
Inverted Hammer
Following a downtrend, this is a Japanese candlestick line that has a long upper shadow and a small real body at the lower end of the session. There should be no, or very little, lower shadow. It has the same shape as the bearish shooting star, but when this line occurs in a downtrend, it is a bullish bottom reversal signal with confirmation the next session when candlestick trading (i.e., a candlestick with a higher open and especially a higher close compared to the inverted hammer’s close).
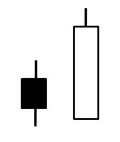
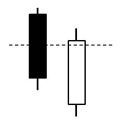
Bullish Engulfing
A bullish engulfing candlestick pattern is comprised of a large white real body that engulfs a small black real body in a downtrend.
Bullish Counter-Attack Lines
Following a black candlestick in a downtrend the market gaps sharply lower on the opening and then closes unchanged from the prior session’s close.
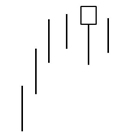
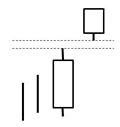
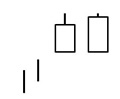
Bullish Gapping Play Rising
High-price gapping play—After a sharp advance, the market consolidates via a series of small real bodies near the recent highs. If prices gap above this consolidation area, it becomes a high-price gapping play.
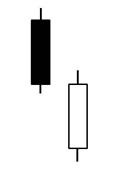
Bullish Harami
A two-candlestick charting pattern in which a small real body holds within the prior session’s unusually large black body. The color of the second real body can be white or black.
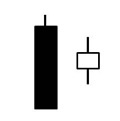
Bullish Harami Cross
A two-candlestick charting pattern in which a doji real body holds within the prior session’s unusually large black real body.
Bullish Piercing Pattern
A Japanese candlestick bottom reversal signal. In a downtrend, a long black candlestick is followed by a gap lower open during the next session. This session finishes as a strong white candlestick that closes more than halfway into the prior black candlestick’s real body. Compare to the on-neck line, the in-neck line, and the thrusting line.
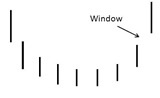
Rising Window
The same as a Western gap. Windows are continuation candlestick patterns. When the market opens a window to the upside, it is a rising window. It is a bullish candlestick pattern and the rising window should be support.
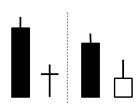
Bullish Separating Line
When the market opens at the same opening as the previous session’s black candle and then closes higher as a white candle.
Bullish Side by Side White Line
Two consecutive white candlesticks that have the same open and whose real bodies are about the same size. In an uptrend, if these side-by-side white lines gap higher, it is a bullish continuation candlestick pattern. In a downtrend, on Japanese candlestick charts these side-by-side white lines are still considered bearish (in spite of their white candles since they come after a falling gap).
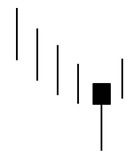
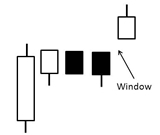
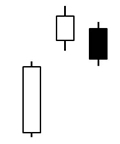
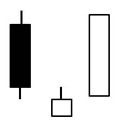
Bullish Tasuki Gap
The bullish gapping tasuki is made of a rising window formed by a white candlestick and then a black candlestick. The black candle opens within the white real body and closes under the white candlestick’s real body. The last two candlesticks of the tasuki should be about the same size.
Bullish Tweezer Bottom
When the same lows are tested on back-to-back sessions.
Bullish Abandoned Baby Bottom
When the same lows are tested on back-to-back sessions.
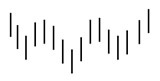
Bullish Frying Pan Bottom
This Japanese candlestick pattern is similar to a Western rounding bottom. A window to the upside confirms this pattern. It is the counterpart of the dumpling top.
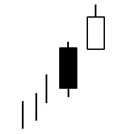
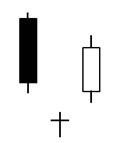
Bullish Morning Star
A bottom reversal pattern formed by three candlesticks. The first is a long black real body, the second is a small real body (white or black) that gaps lower to form a star, and the third is a white candlestick that closes well into the first session’s black real body. Its opposite is the evening star candlestick pattern.
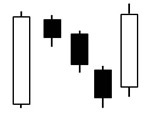
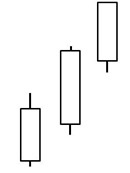
Bullish Rising Three
The rising three methods is a bullish continuation pattern. A tall white candlestick precedes three small, usually black, real bodies that hold within the white candlestick’s range. The forth line of this pattern is a strong white candlestick that closes at a new high for the move.
Three Buddha Bottom
An inverted three Buddha (Three Buddha Bottom) is the same as the Western inverted head and shoulders. In Japanese charting terminology, it is a three river bottom in which the middle river is the longest.
Bullish Three White Soldiers
This is a candlestick charting pattern is a group of three white candlesticks with consecutively higher closes (with each closing near the highs of the session). These three white candles presage more strength if they appear after a period of stable prices or at a low price area. Also called Three Advancing Soldiers.
Bullish Tower Bottom
Comprised of one or more long black candles followed by congestion and then one or more long white candlesticks.
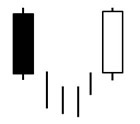
Bullish Unique Three River Bottom
Unique three river bottom is a rare bullish candlestick bottom reversal pattern indicating the end of existing downtrend and the start of a new uptrend. This is a three candlestick formation which is formed at the end of a downtrend, first indicating market uncertainty and then bullish market reversal.
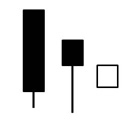
Bearish Belt Hold
A bearish belt-hold is a long black candlestick that opens on, or near, its high and closes well off its open. Also referred to as a black opening shaven head.
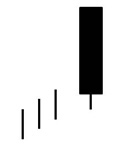
Bearish Hanging Man
A top candlestick reversal pattern that requires confirmation. The hanging man and the hammer are both the same type of candlestick pattern (i.e., a small real body [white or black], with little or no upper shadow, at the top of the session’s range and a very long lower shadow). But when this line appears during an uptrend, it becomes a bearish hanging man. It signals the market has become vulnerable, but there should be bearish confirmation the next session with an open, and better is a close, under the hanging man’s real body. In principle, the hanging man’s lower shadow should be two or three times the height of the real body.