descriptive statistics Flashcards
(22 cards)
<!--StartFragment-->
Tools for Continuous data<!--EndFragment-->
Graphs
Histograms
Cumulative Relative Frequency plots (ogives)
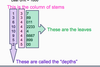
Stem and leaf plots
Boxplots
Line chart for data against time
Middle – mean, median
Spread – variance, range, quartiles
types of data
categorical or numerical
Other sorts of information – e.g. comments in interview/survey – qualitative
what does categorical data consist of
nominal
ordinal
what does numerical data consist of?
discrete (count data) or continuous (also called interval)
what is nominal data?
type of categorical data
faculty of study, eye colour, job, no order,
what is ordinal data?
type of categorical data
there is order: rank teaching as poor/fair/good/verygood
tools for categorical data
Graphs
Bar charts (different to histograms – you can mix up order of columns and it still makes sense)
Pie charts (use with caution)
Numeric
Mode – most frequently occurring observation
Frequency of each category
Examples in Minitab
what are different types of modality a histogram can show?
uni-modal, bi-modal, tri-modal, multi-modal
bimodal histogram
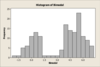
how to interpret histogram?
- *Modality** – uni-modal, bi-modal, tri-modal, multi-modal
- *Modal class** – class with highest number of observations (“modal class is centred at approximately…”)
- *Skewness vs symmetry**
Could choose instead a relative frequency histogram: replace frequency for each class by
class frequency/total number of obs.
what is a disadvantage of using a histogram?
how may this be resolved?
actual observation is lost by being grouped
The stem and leaf display is an attempt to get similar information as a histogram, but without losing the actual observations
steps to creating a stem and leaf plot
Step 1: split each observation into a stem and a leaf, e.g.
If observations are (1.2, 1.5, 2.9 ….); stem = unit; leaf = decimal
If observations are (42.1, 38.4, 53.8….); stem = tens, leaf = units (or unit-decimal)
Step 2: write stems in left column; put leaves in right column.
features of stem and leaf plot
what is Cumulative Relative Frequency Distribution
Relative frequency distribution histogram – proportion in each class
Cumulative relative frequency distribution – proportion up to and including that class
Ogive – graph of cumulative relative frequencies; also called empirical cumulative density function

what does cumulative density function look like?

how to calculate length of whisker?
1.5 x interquartile range
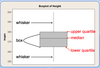
how to calculate location of percentiles in boxplot?


Which measure of centre is best?
for continuous data
Mean generally most commonly used; but it is sensitive to extreme values
If data skewed/extreme values present, median better, e.g. real estate prices (we say the median is robust to outliers)
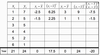
Mode generally best for categorical data – e.g. restaurant service quality (below): mode is very good. (ordinal)

differences between population and sampel
Populations have parameters – certain true values which describe them. E.g. if we measure every individual, we can calculate the exact average and exact variance of the population. These are called population parameters.
a sample we calculate statistics, or estimates of the parameters. Use sample statistics to approximate population parameters. E.g. from a sample we can estimate the true population mean by using the same mean; if we have a sample standard deviation, we can estimate the population standard deviation.
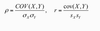
calculate covariance and correlation
correlation formula for population and for sample