Medicine in Society Flashcards
(38 cards)
Case-control study
- Observational and retrospective
- Compares group of people with disease to group without
- ID’s risk factors
- Asks, “what happened”
- Odds ratio
Cohort study
- Observational
- Groups according to risk factors and sees what happens to them
- Looks to see if exposure increases likelihood of disease
- Asks, “What will happen?” Rate of exposed/rate of unexposed
- Relative risk (RR)
Cross-sectional study
- Observational
- Gives snapshot of disease at one point in time
- Disease prevalence
Twin concordance study
- Compares the frequency with which both monozygotic twins or both dizygotic twins develop a disease
- Measures heritability
Adoption study
- Compares siblings raised by biologic vs. adoptive parents
- Measures heritability and influence of environmental factors
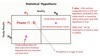
Clinical trial
Phases
- Experimental study involving humans
- Compares therapeutic benefit of 2 or more treatments or of treatment and placebo
- Highest quality when randomized, controlled, double blinded
- Phase I - Is it safe - safety, toxicity, pharmacokinetcs
- Phase II - Does it work - Efficacy, optimal dosing, adverse effects
- Phase III - Does it work better - compares new treatment to current standard of care.
- Phase IV - Are there rare adverse affects? Postmarketing surveillance trial of patients after approval.
Meta-analysis
- The systematic process of using statistical methods to combine the results of different studies
- systematic, organized, and structured evaluation of a problem using information, commonly in the form of statistical tables, from a number of different studies of a problem
- Need strict inclusion criteria and selection bias may creep in
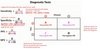
Diagnostic Tests
- Sensitivity = A/(A+C)
- Specificity = D/(D+B)
- PPV = A/(A+B);
- PPV - tells you the probability that a person who tests positive actually has the disease
- NPV = D/(C+D)
- NPV - tells you the probability that a person who tests negative is actually free of the disease
- Sensitivity and Specificity are the vertical columns
- PPV and NPV are the horizontal columns
Which diagnostic tests change with prevalence of disease?
Sensitivity and Specificity don’t change - static
PPV and NPV change depending on prevalence of disease in society.
- ↑PPV with ↑prevalence of disease
- ↓ prevalence will ↑ NPV
Prevalence vs. Incidence
- Point prevalence = total cases in population at a given time/ total population at a given time
- Incidence = new cases in population over a given time period/total population at risk during that time period
- Incidence = new incidence
What is prevalence approximately equal to?
Prevalence ≈ incidence x disease duration
Prealence > Incidence for chronic diseases (diabetes)
Prevalence = incidence for acute disease (e.g., common cold)
Odds ratio vs. Relative risk
Odds ratio for case control studies:
- Odds of having disease in exposed group divided by odds of having disease in unexposed group
- Approximates relative risk if prevalence of disease is not too high
Relative risk (RR) for cohort studies:
- Probability of getting a disease in the exposed group divided by the probability of getting a disease in the unexposed group
Attributable risk
AR = incidence of disease in the exposed group - incidence of disease in the unexposed group
Example: In a population of sexually-active people, 30% have HPV infection. In a population of people who are not sexually active, only 5% have HPV infection. The attributable risk of sexual activity to HPV is 25%.
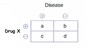
Absolute Risk Reduction
The reduction in risk associated with a treatment as compated to placebo
ARR = C/(C+D) - A/(A+B)
Example:
People that got the disease on the drug = 5%
People that got the disease w/o drug = 20%
Absolute risk reduction is 15%
Number needed to treat
- NNT = 1/absolute risk reduction
- Number of patients you would need to treat in order to save/effect one life
- Important number to help determine if a drug should be used or is cost effective
- Example: If out of 10,000 patients that took t-PA during a STEMI, 100 were saved by the t-PA, then the NTT is 100. In other words, you would need to treat 100 patients in order to save/effect 1 life
Number needed to harm
- NNH = 1/attributable risk
- NNH=1/AR
- (AR = incidence of disease in exposed group - incidence of disease in unexposed group)
Precision vs. Accuracy
Precision is:
- The consistency and reproducibility of a test (reliability)
- The absence of random variation in a test
- Reduced by random error
Accuracy is the truness of the test measurements (validity):
- Reduced by systematic error
Ways to reduce bias?
- Blind studies (double-blind to limit influences of participants and researchers on interpretaiton of outcome
- Placebo responses
- Crossover studies (each subject acts as own control to limit confounding bias)
- Randomization to limit selection bias and confounding bias
The referral centers for a trial of a new anticancer drug have more patients with end stage disease than early stage, so more patients with end stage disease are referred for the trial than early stage disease.
Selection bias - nonrandom assignment to study group (e.g., Berkson’s bias, loss to follow-up)
Studies performed on patients that have been hospitalized
- Berkson’s bias - type of selection bias
- The result is that two independent events become conditionally dependent (negatively dependent) given that at least one of them occurs
- classic illustration involves a retrospective study examining a risk factor for a disease in a statistical sample from a hospital in-patient population. If a control group is also ascertained from the in-patient population, a difference in hospital admission rates for the case sample and control sample can result in a spurious association between the disease and the risk factor.
Parents of autism patients having a more detailed recall of events and illnesses in theirchild’s first two years of life compared to parents of healthy controls.
- Recall bias - knowledge of presence of disorder alters recall by subjects
A study performed in China may not be generalizable to the US population.
- Sampling bias - Subjects are not representative relative to general population
- Results not generalizable
- Sampe does not represent population
Sending a survey out to people diagnosed with a fatal illness 5 years after diagnosis will preferentially sample those with a low grade disease (or few comorbidities)
- **Late-look bias **- information gathered at an inappropriate time
- e.g. using a survey to study a fatal disease (only those patients still alive will be able to answer the survey)
The positive benefit of a new drug during a study simply may have been due to thefact that study participants were required to attend clinic monthly, where they received extra disease education and counseling compared with the controls.
- Procedure bias - subjects in different groups are not treated the same
- e.g. more attention is paid to treatment group, stimulating greater compliance