What do the electrodes outside of cells record?
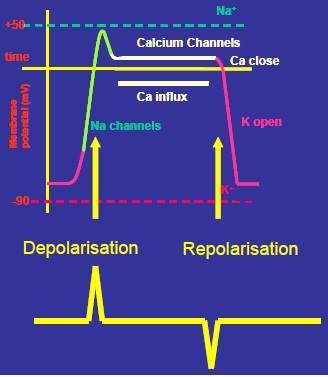
They record only CHANGES in membrane potential (there is no recording/no electrical activity when membrane potential is constant).
The electrodes on the skin therefore ‘see ‘ 2 signals with each systole: one on depolarisation (at the beginning of the AP) and one on repolarization (at the end of the AP).
So one AP generates 2 signals.
Describe electrical activity in the myocardium
The myocardium is a large mass of muscle undergoing electrical changes; all cells are more or less transmitting an AP at the same time.
This generates a large changing electrical field which can be detected by electrodes on the body surface.
This is the electrocardiogram (ECG)
Electrodes outside of the cell ‘see’ a different signal to those inside.
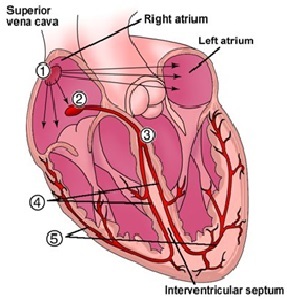
Describe in general terms the pattern of spread of excitation over the normal heart
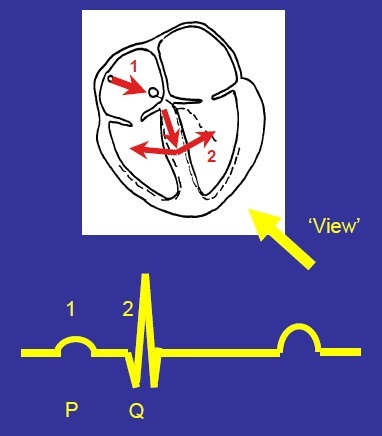
An action potential is generated by the pacemaker cells in the SAN (1) and electrical activity spreads over the surface of the heart to the AV node, where there is a delay of ~120ms (2).
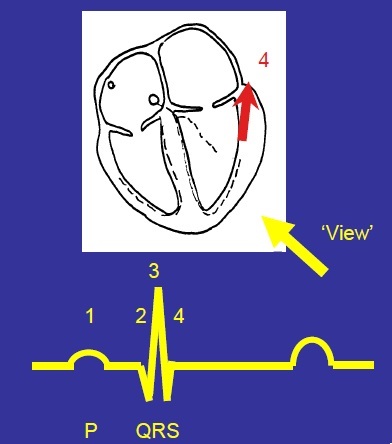
After the delay the excitation spreads down the septum through the specialised Purkinje fibres of the left and right bundle of His branches (3) then out over the ventricular myocardium, from inside –> outside (endocardial –> epicardial surface) and then spreads upwards until all ventricular cells are depolarised (4/5)
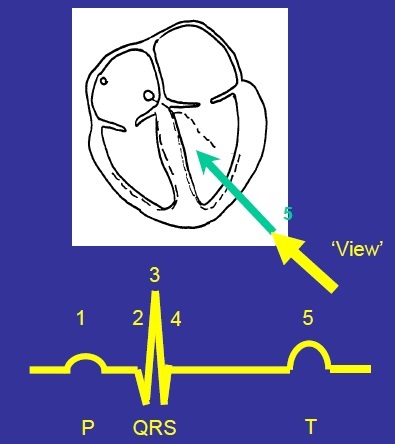
Describe the pattern of repolarization
After ~280ms, cells be in to repolarise.
Repolarization spreads in the opposite direction over the ventricle to depolarisation (epicardial –> endocardial surface) - as the heart depolarises, it twists and contracts so repolarisation happens in the opposite direction.
Discuss the term Electrode ‘View’
What an electrode ‘sees’ depends on its position relative to the spread of activity - depending on its position, it will see something different.
What are the rules governing the sign of the signal recorded by a positive recording electrode when depolarisation and repolarisation spread towards and away from that electrode?
Depolarisation moving towards an electrode creates an UPWARD going signal ‘blip’.
Depolarisation moving away from an electrode creates a DOWNWARD signal ‘blip’.
Repolarisation moving towards an electrode creates a DOWNWARD going signal ‘blip’.
Repolarisation moving away from an electrode creates an UPWARD signal ‘blip’.
Signal also depends on:
- How much muscle is depolarising (large amount of muscle = large signal)
- How directly towards the electrode the excitation is moving (direct/straight spread = large signal, the more indirect the spread of activity (at an angle), the smaller the signal).
Explain the P wave formation
Atrial depolarisation will produce a small upward deflection
(small because little muscle is depolarising, upwards because depolarisation is moving towards the view - towards the electrode).
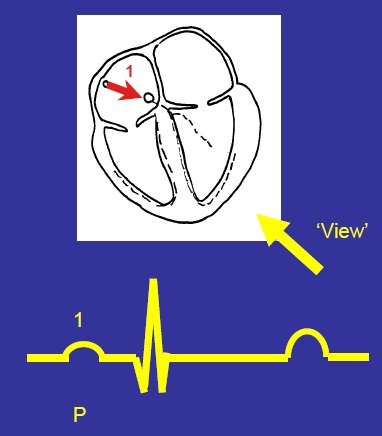
Why is there is a constant line after the P wave?
Indicates the period the electrical activity is delayed at the AV node (no blips as no change in electrical activity)
Explain the Q wave formation
Excitation spreads about halfway down the septum, then out across the acid of the heart, producing a small downward deflection
(downward because depolarisation is moving away, small because depolarisation is moving away at an angle - not direct)
Describe the R wave formation
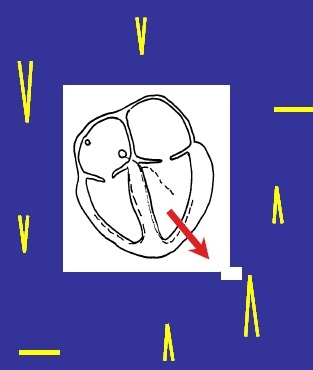
Depolarisation spreads through the ventricular muscle along an axis slightly to the left of the septum.
Produces a large upward deflection - upward because depolarisation moving toward view, large because lots of muscle is involved and the signal is moving directly towards the electrode.
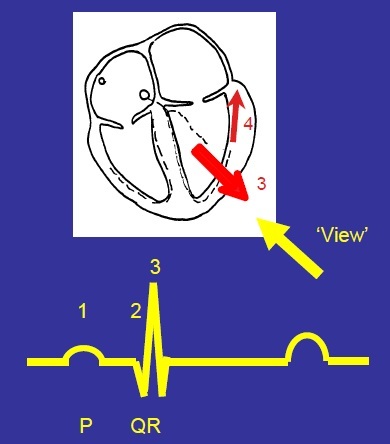
Describe the S wave formation
Depolarisation spreads upwards to the base of the ventricles (near the valves).
This produces a small downward deflection (downward because depolarisation is moving away from the view, small because the depolarisation is not moving directly away - moving away at an angle).
Why is there a straight line after the S wave?
Period between depolarisation and repolarisation where there is no change in electrical activity so no signals.
Ventricular contraction (~280ms)
Explain the T wave formation
Repolarisation begins on the epicardial surface.
This spreads through the ventricular myocardium in the opposite way to depolarisation (from epicardium to endocardium).
Produces a small upward deflection (upward because repolarisation is moving away from view, medium because timing in different cells is dispersed).
Put all the different wave formations together
P wave - atrial depolarisation
Q wave - septal depolarisation spreading to ventricle
R wave - main ventricular depolarisation
S wave - end ventricular depolarisation
T wave - ventricular repolarisation
Why isn’t there a wave for Atrial Repolarisation?
Atrial repolarisation got lost in the QRS complex (atrial cells repolarise at the same time as ventricular depolarisation).
Describe how the QRS Complex will change if the viewing electrode is moved around a circle with the heart at its centre.
As the electrode position moved around the heart, the directions and amplitude of the waves change predictably.
An electrode viewing the R wave head on will see a large upward deflection.
An electrode viewing the R wave from sideways on will see no signal
An electrode viewing the R end on sees a large downward signal.
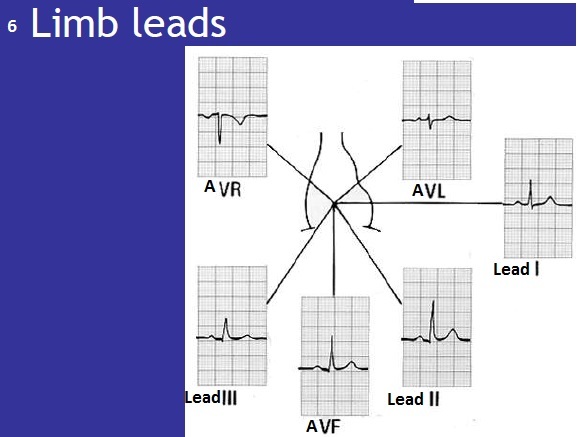
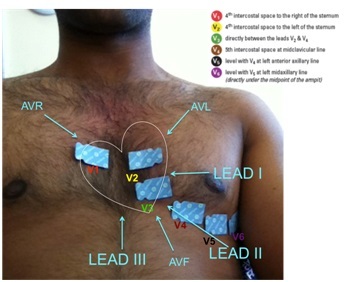
Be able to place electrodes correctly to record (12-lead electrode)
Limb leads: one on each limb (only 3 are recording - right lower limb is neutral).
The limb leads provide a vertical heart of the heart.
6 chest leads provide a horizontal view of the heart:
V1- 4th intercostal space to the right of the sternum
V2 - 4th intercostal space to the left of the sternum
V3 - directly between the leads V2 and V4
V4 - 5th intercostal space at midclavicular line
V5 - level with V4 at left anterior axillary line.
V6 - level with V5 at left mid axillary line (directly under the midpoint of the armpit).
What is a “lead” and why do we compare multiple leads?
A “lead” is an electrical view of the heart (a particular electrode position).
By comparing multiple leads (looking at the heart from different angles) we can localise abnormalities and detect changes in electrical axis
What are differential amplifiers and why are they used?
Used because cellular signals are very small.
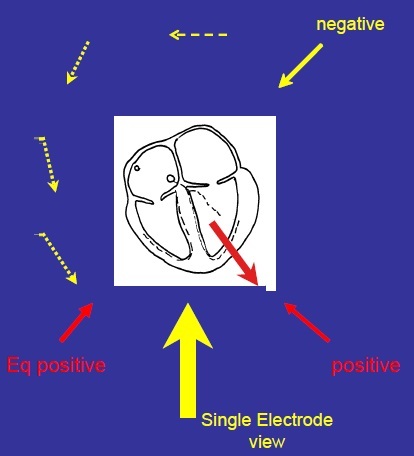
Differential amplifiers have one positive and one negative electrode but they are converted to one view.
Amplifiers take the signal coming in on the negative input and invert it, add it to the signal from the positive input before amplifying the total. [(1/n +P)a].
This produces a single electrode view.
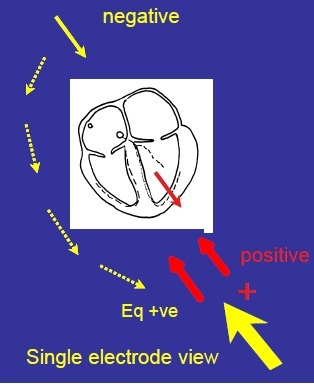
Describe the Single Electrode View at Lead II
Positive electrode bottom left.
Negative electrode top left is converted to equivalent positive of negative bottom left.
Put the two together - two views from BOTTOM LEFT - same direction.
2 positives combined = 1 output.
Lead II views the heart towards the apex
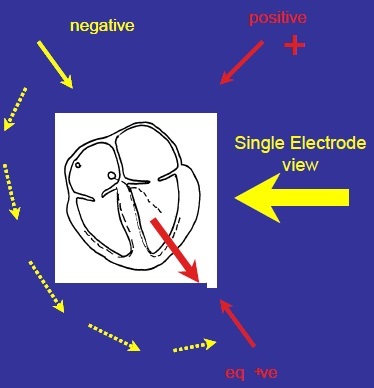
Describe the Single Electrode View at Lead I
Positive electrode top left
Negative electrode top right is converted to equivalent positive of negative –> bottom left
Put the two together - single electrode view looking from LEFT SIDE.
Describe the Single Electrode View at Lead III
Positive bottom left
Negative top left is converted to equivalent positive - bottom right.
Put the two together - single electrode view looking at the heart FROM THE BOTTOM (straight up)
Describe the Single Electrode View at AVR
Looking at the heart from top right

Describe the Single Electrode View at AVL
Looking at the heart from top left