Chapter 3 Flashcards

(59 cards)

1
Q

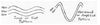
These long waves also called the

A

Rossby waves generally found in mid‐ latitude (23.5°N/S‐66.5°N/S) westerlies

2
Q

Rossby waves form primarily due to

A

the earth’s geography

3
Q

Rossby waves form primarily due to the earth’s geography, which results in:

A

a) Differential heating due to uneven earth’s surface and
b) Vertical motion forced by orography

4
Q

The length of long waves

A

vary from around 6,000 to 8,000 km or more

5
Q

There are usually between ………………… longwaves that encircle the NHS at any given time.

A

2 and 7

6
Q

long waves generally move

A

very slowly from west to east. But occasionally they will become stationary or retrograde (move east to west)

7
Q

The height of a pressure surface at any level (e.g., the 500 mb surface) is related to

A

the (density averaged) temperature of the atmosphere below that level

8
Q

The height of a pressure surface at any level (e.g., the 500 mb surface) is related to the (density averaged) temperature of the atmosphere below that level:

A

the higher the temerature, the higher the height of the pressure level

9
Q

Where the height lines bow northward (………………..)

A

(a ridge) warm air has moved north

10
Q

where the height lines bow southward (……………)

A

(a trough), cold air has moved south

11
Q

warmer than average temperatures can be expected underneath

A

ridges

12
Q

colder than average temperatures can be expected underneath

A

troughs

13
Q

digging

A

Cold air moving south results in strengthening or ‘digging’ southward of an upper level trough

14
Q

building

A

Warm air moving north results in strengthening or ‘building’ northward of an
upper level trough

15
Q

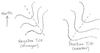
compare zonal and meridional patterns

A

A ‘zonal’ (more flat) 500 mb pattern exhibits little wave structure, while a ‘meridional’ (or amplified) 500 mb pattern contains large northward and southward excursions.

16
Q

Surface level storm systems, and associated cold fronts, move

A

very fast from west to east in zonal flows as they have very little north to south (or south to north) movement.

17
Q

The 500mb pattern can also be used to

A

locate where surface storms and precipitation are most likely to be occurring

18
Q

The 500mb pattern can also be used to locate where surface storms and precipitation are most likely to be occurring Surface storms and precipitation are most often found over

A

areas downstream of 500 mb trough.

19
Q

The 500mb pattern can also be used to locate where surface storms and precipitation are most likely to be occurring Surface storms and precipitation are most often found over areas downstream of 500 mb trough. this is because

A

the convergence downstream of the trough forces the surface air to move upward towards the tropopause (dynamical lifting of air).

20
Q

Conversely, sinking air motion is forced over areas

A

downstream of ridges, where clouds do not develop. Underneath these areas fair weather is most likely

21
Q

Thus, by looking at a 500 mb map, one should be able to distinguish where

A

precipitation is most likely and where fair weather is most likely

22
Q

The shape and strength of a 500 mb trough often indicates its

A

dynamical strength, i.e., its potential to force strong rising motion in the atmosphere and hence strong areas of precipitation.

23
Q
The factors (related to 500 mb pattern), that act to increase divergence and hence
rising motion and precipitation are:
A
  1. Stronger winds increase divergence. Therefore, the more closely spaced the height lines, the stronger the divergence downwind of troughs.
  2. The more amplified the pattern (amplitude of the ridge/trough pattern), the stronger the divergence downwind of troughs
  3. The sharper the curvature of a trough, the stronger the divergence downwind of the trough
  4. The orientation of the trough axis with respect to a north‐south line.
24
Q

(GRAPH) Stronger winds increase divergence. Therefore, the more closely spaced the
height lines, the stronger the divergence downwind of troughs.

25
(GRAPH) The more amplified the pattern (amplitude of the ridge/trough pattern), the stronger the divergence downwind of troughs.
26
(GRAPH) The sharper the curvature of a trough, the stronger the divergence downwind of the trough.
27
negative tilt
Troughs that are oriented along a northwest to southeast line
28
positive tilt
troughs oriented along a northeast to southwest axis
29
a negatively tilted trough indicates a
stronger weather system
30
(GRAPH) Troughs that are oriented along a northwest to southeast line are said to a have a "negative tilt", while troughs oriented along a northeast to southwest axis are said to have a "positive tilt."
31
The atmosphere contains waves over a large range of sizes from the planetary‐ scale longwaves to
minute sound waves that have no impact on weather
32
shortwaves
there are often smaller wavesthat are superimposed on the longwave pattern that do have a significant impact on weather. These are called short waves and contain shortwave troughs and shortwave ridges
33
These shortwaves indicate
smaller regions of warm/cold temperature contrasts and forced rising or sinking vertical air motions.
34
shortwave graph
35
Because they are much smaller than longwaves, shortwave troughs often have a
much sharper curvature than longwaves and hence stronger divergence and forced rising motion
36
shortwaves can indicate
the position of a strong weather system especially if it is sharply curved
37
Shortwaves typically flow through
the longwave pattern following the longwave wind direction but at a slower speed.
38
Shortwaves tend to strengthen as they move into
the region just downstream of a longwave trough
39
Shortwaves tend to strengthen as they move into the region just downstream of a longwave trough and weaken as they move into
the region just downstream of a longwave ridge
40
Often the precipitation gets concentrated near
a shortwave trough, then moves along with the shortwave
41
Often the precipitation gets concentrated near a shortwave trough, then moves along with the shortwave. You may also notice small areas of precipitation just
downwind of longwave ridges, where you didn't expect to see it. This again can be associated with a shortwave trough
42
It is common for a region downwind of a longwave trough to have
occasional periods of precipitation as shortwaves ripple though the longwave pattern, rather than continuous precipitation.
43
Jet Streams
A narrow current of high speed air typically found in the upper troposphere and characterized by strong vertical and horizontal wind shears.
44
The minimum wind speed used to analyze the location of the jet stream is
50 kt
45
Jet streak:
An area of maximum wind speed along the jet stream axis denoted by a closed isotach.
46
An analysis model is
an idealized representation of a weather system that helps a meteorologist to visualize that system, its associated weather, and evolution.
47
In the case of the jet stream, the analysis model (Figure) is limited to
the general isotachs pattern around a jet streak.
48
The bold line with the arrow head represents
the jet stream axis or line of maximum wind speed.
49
The isotach gradient on the right side of the axis is
weaker than that on the left.
50
The isotach gradient on the right side of the axis is weaker than that on the left. this means that
the horizontal wind shear is typically greater on the left side of the jet axis than it is on the right.
51
An analysis model serves as
an idealization for the analyst who is constructing isotachs to identify the jet streak location
52
An analysis model serves as an idealization for the analyst who is constructing isotachs to identify the jet streak location. • The idea is to
fit the observations to the model as closely as possible
53
An analysis model serves as an idealization for the analyst who is constructing isotachs to identify the jet streak location. • The idea is to fit the observations to the model as closely as possible. • Where there is an abundance of data,
isotachs are drawn to the data. However, if there is a lack of data, the model helps fill in the gaps.
54
An analysis model serves as an idealization for the analyst who is constructing isotachs to identify the jet streak location. • The idea is to fit the observations to the model as closely as possible. • Where there is an abundance of data, isotachs are drawn to the data. However, if there is a lack of data, the model helps fill in the gaps. • When you finish your analysis it should
look similar to the idealization
55
The jet stream is a major component of the
mid‐latitude flow
56
The jet stream is a major component of the mid‐latitude flow. It is a source of
kinetic energy
57
The jet stream is a major component of the mid‐latitude flow. It is a source of kinetic energy, impacts the
* genesis and intensification of surface cyclones, * influences thunderstorm development and * affects synoptic scale vertical motion in the troposphere
58
Jet streams change
(depending on the season) * position * location * strength
59
(Jet stream) In the winter, areas in the NHS may
get colder than normal periods as the jet stream dips "lower" bringing cold air in from the polar regions.