Inferential Statistics Flashcards
(15 cards)
Name the three types of distribution
- Population distribution
- Sample Distributions
- Sampling Distributions
Population Distributions
The distribution of all scores in the populations.
Ex: Imagine our population is the McGill students and we look at their height
Notice that male and female separate they are each a normal distribution but together they are not.
Sample Distribution
The distribution of all scores in a sample of the population.
Notice that random Variation enters into play when you compare two different samples drawn randomly
Random Variation
Two samples randomly drawn from the same population will practically never be identical.
Sampling Distributions
Random Variation in Sample Statistics
Just like individual observations vary randomly from sample to sample, so do statistics generated from those samples.
Moreover, just like the variation among observations can be described with probability distributions, so can the variation in the sample statistics.
True or False
Sampling distribution is the for statistical inference and hypothesis testing
True
Every statistic has a sampling distribution: means, medians, standard deviations, maxima/minima, etc.
What do you expect the mean of the distribution of means to be?
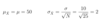
Mean of sampling distributions of means = Population mean
mean = mu
What two aspects seem to affect the variation of the distribution of the means?
- The population variation. The more varied the population is, the more varied the samples are, which leads to greater variation in the means generated from those samples.
- The sample size. The larger our sample size, the more accurate our estimates become, which leads to less variation in the means generated from those samples.
True or False
The larger your sample size, the smaller your sample distribution
True
Standard Error
The standard error is the standard deviation of the sampling distribution.
Denoted SE
Notice:
S.D. Sampling Distribution = S.D Population/ sqrt(sample size)
So
SE = sigma/ sqrt(N)
True or False
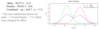
If the sample size = 1, then the shape of the sampling distribution of means is the same as the population.
As the sample size increases, the shape becomes smoother until the sample size is big enough that we get a bell curve aka. normal distribution
True
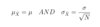
The sampling distribution of the mean approaches normality with
mu_Xbar = ? and sigma_Xbar = ?
Question
Humour Quotient (HQ) (a continuous variable) is normally distributed in the population with a mean of 50 and a standard deviation of 10.What is the sampling distribution of HQ for
N = 25?