Topic 3: Descriptive Statistics II Flashcards
(24 cards)
Percentile
If you order the data from smallest to largest percentiles are the ones that divide it into hundredths.
Quartiles

Procedure to find percentiles
Rank order scores: K-th percentile is the score whose rank (position) corresponds to the i=K(N+ 1)/100 observation.
Median
Center of the data
(N+1)/2
Quartiles Procedure
- Find median
- Find Q1 = median of the lower half
- Find Q3 = median of the upper half
Interquartile Range IQR
Indicates the spread of the middle half of the data.
Q3-Q1 = IQR
What can we use to find outliers?
a) mean
b) Interquartile range
c) median
b) Interquartile range
How can we identify an outlier?
A score can be an outlier if it is less than (1.5 IQR) below the first quartile or (1.5 IQR) above the third quartile.
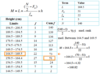
Median for Continuous Data with Duplication at the Median
M = L + ((N/2) F_b)h/f_m
where:
L = exact lower limit of interval containing the median
Fb= cumulative frequency up to, but not including, the median interval
fm= frequency in the median interval
h = interval width (upper exact limit - lower exact limit)
N = number of cases
Find the median

Do A1, #2 d)
Central tendency
mean, average
Mean of frequency distribution

Deviation score
Where X is the observation

True or False
Sum of deviations from mean = 0
True
Sum of squared deviations

True or False
The sum of squared deviations = 0
False
Not necessarly
Mode
Most frequent score
Mode Frequency Distribution
Midpoint of interval
Mode of Two peaks
Then two modes (bimodal) is not next to each other
Mode Two or mode columns with same high frequency next to each other
Mean of adjacent intervals
Mode Rectangular distribution
No mode
Skewness
Blue: Symmetrical distribution
Yellow: Negatively Skewed
Green: Positively Skewed

True or False
Outliers affect the median.
False,
outliers affect the mean, not the median
