Lecture 8 Flashcards
(93 cards)
What will I be learning today?
How to interpret financial statements.
Which company displays being a growth firmc Aslan PLC or Gilderoy?
What 4 things should you took about when answering this question?

The answer is Aslan Plc
1) Cash flow from investing activities
2) Cash flow from operating activites
3) depreciation vs purchase of equipment
4) compare the working capitals ( Trade receivables, Trade payables and inventory.
When looking at Cash flow from investing activities why does Alsns show as a growth firm?

For Aslan Plc their cash flow for investing activites is ( 80000) meaning that they are investing in the future, purchasing equipment, whereas Gilderoy Plc has a positive cash flow from investing activities 40000) showing that they are selling equipment, not investing for the future.
When looking at overall cash flow from financing activites, why does Aslan display a growth firm and Gilderoy doesn’t?

Gilderoy PLC is returning money back ( paying loans, issuing dividends hence -110,000 cash flow from financing activites) however Aslan have a positive cash flow from investing activites showing that they may have issued shares and repayed a bit of the loan and raising fresh capital.
When looking at depreciation and purchase equipment why does Aslan Plc display a growth firm and Gilderoy doesn’t?
Aslan Plc depreciation is 40000 and purchases wass ( 90000), this shows that it is not only replacing used up equipment but purchasing extra equipment for future growth.
In the case of Gilderoy the depreciation was 100000 but purchase of equipment was 0, meaning that even if the equipment is getting used up, it is not replacing the used up equipment.
How does A/R ( ONE OF THE WORKING CAPITALS SHOW THAT ASLAN IS A GROWTH FIRM AND GILDEROY IS NOT?)

In the case of Aslan, they have sold a lot, leading to higher receivables, which is seen as a negative cash flow (20000)
Whereass Gilderoy A/R is positive 30000, this tells you yhat their is a decrease in accounts receivable, showing that it is collecting money.
How does the trade payables of ASLAN AND GILDEROY show that Aslan is a growth firm and Gilderoy is a early decline stage firm?

In the case of Aslan their T/P is 45000, meaning they are buying more from suppliers and taking more time to repay, so T/P is high.
Whereas in the case of Gilderoy PLC they are collecting cash from customers repaying suppliers, so they are losing money, hence negative accounts payable (160000), showing early decline stage)
How does inventories between Aslan and Gilderoy show that Aslan is a growth firm and Gilderoy is early decline stage firm?
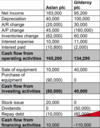
In the case of Aslan inventory change is ( 62000) negative meaning inventory has gone up, meaning the company is buying more to sell more.
For Gildeory PLC, inventories change is positive, meaning that they are selling the equipment of what isi remaining, not involved in active trading.
What are 3 financial analysis tools, to intrepret financial statements?
Common size financial statements
Trend analysis
Financial ratios
Finish off the sentence, Different user groups ….?
Expect different types of returns
What are 2 primary types of user groups of financial statements?
Lenders and shareholders, they use financial statements to predict their expected returns and assess the risks asscoiated with those returns.
What are lenders interested when looking at financial statemenets?
They are interested in whether the firm will surivive the nect period and repay loan ( short term liqudity and long term solvency)
What are Shareholders interested when looking at financial statemenets?
They are concerned with profabitatbility and future share prices.
What is common sizing of financial statements?
You restate the financial statements as a proportion of some particular number, it is in a standardised form, year on year, you can compare with.
For an income statement what could be common sizing?
income statement in which each line item is expressed as a percentage of the value of revenue or sales.
What are 2 types of common sizing?
Veritcal and horizontal
What is vertical common sizing?
Expresses all figures in a particular statement in terms of one of the figures in that statement.
The base figure can be for example:
a) Sales or revenues in IS
b) Total assets in BS
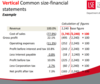
How would common sizing look on an I/S statement ( picture)
Revenue(base figure 2240)
COS (1745)
Gross profit (495)
operating expenses(252)
profit before interest and tax (243)
less interest payable (18)
profit before tax (225)
less corporation tax (60)
net profit after tax(165)
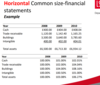
What is horizontal common sizing?
You take a particular year as a base year e.g. how has the firm improved after the financial crisis, so you would take the base year as the year of the financial crisis (2008) and you would express every years figures as a percentage of base year.
Show an example of horizontal common sizing?

What is trend analysis and give an example?
Trend analysis is based on the idea that what has happened in the past gives traders an idea of what will happen in the future. e.g. can use it to predict future stock prices, based on previous years.
It analysis key ratios over time, and show trends.

Suppose that we have two different businesses: A is a small business and B is a large business Net profit is £10,000 and £80,000 for A and B , respectively. Now, can you determine which company is more profitable ?
The answer is No because there is not enough information as B could be a very big company only generating 80,000, so you need to compare output generated with some measure of input.
Now, Suppose that stockholders’ equity is £100,000 and £1000,000 for A and B , respectively
And we know that Net profit is £10,000 and £80,000 for A and B , respectively.
Which company is more profitable?
It is company A

What is the numbers 10% and 8% from previous answer an example of?
A fianancial ratio ( Financial ratios are created with the use of numerical values taken from financial statements to gain meaningful information about a company. )


