Behavioral Science - Epidemiology / Biostatistics Flashcards
(52 cards)
1
Q
Cross-sectional study
- Study Type
- Design
- Measures/Example
A
- Study Type
- Observational
- Design
- Collects data from a group of people to assess frequency of disease (and related risk factors) at a particular point in time.
- Asks, “What is happening?””
- Measures/Example
- Disease prevalence.
- Can show risk factor association with disease, but does not establish causality.
2
Q
Case-control study
- Study Type
- Design
- Measures/Example
A
- Study Type
- Observational and retrospective
- Design
- Compares a group of people with disease to a group without disease.
- Looks for prior exposure or risk factor.
- Asks, “What happened?”
- Measures/Examples
- Odds ratio (OR).
- “Patients with COPD had higher odds of a history of smoking than those without COPD had.”
3
Q
Cohort study
- Study Type
- Design
- Measures/Example
A
- Study Type
- Observational and prospective or retrospective
- Design
- Compares a group with a given exposure or risk factor to a group without such exposure.
- Looks to see if exposure increased the likelihood of disease.
- Can be prospective (asks, “Who will develop disease?”) or retrospective (asks, “Who developed the disease [exposed vs. nonexposed]?”).
- Measures/Example
- Relative risk (RR).
- “Smokers had a higher risk of developing COPD than nonsmokers had.”
4
Q
Twin concordance study
- Design
- Measures/Example
A
- Design
- Compares the frequency with which both monozygotic twins or both dizygotic twins develop same disease.
- Measures/Example
- Measures heritability and influence of environmental factors (“nature vs. nurture”).
5
Q
Adoption study
- Design
- Measures/Example
A
- Design
- Compares siblings raised by biological vs. adoptive parents.
- Measures/Example
- Measures heritability and influence of environmental factors.
6
Q
Clinical trial
A
- Experimental study involving humans.
- Compares therapeutic benefits of 2 or more treatments, or of treatment and placebo.
- Study quality improves when study is randomized, controlled, and double-blinded (i.e., neither patient nor doctor knows whether the patient is in the treatment or control group).
- Triple-blind refers to the additional blinding of the researchers analyzing the data.
7
Q
Drug Trials: Phase I
- Typical Study Sample
- Purpose
A
- Typical Study Sample
- Small number of healthy volunteers.
- Purpose
- “Is it safe?”
- Assesses safety, toxicity, and pharmacokinetics.
8
Q
Drug Trials: Phase II
- Typical Study Sample
- Purpose
A
- Typical Study Sample
- Small number of patients with disease of interest.
- Purpose
- “Does it work?”
- Assesses treatment efficacy, optimal dosing, and adverse effects.
9
Q
Drug Trials: Phase III
- Typical Study Sample
- Purpose
A
- Typical Study Sample
- Large number of patients randomly assigned either to the treatment under investigation or to the best available treatment (or placebo).
- Purpose
- “Is it as good or better?”
- Compares the new treatment to the current standard of care.
10
Q
Drug Trials: Phase IV
- Typical Study Sample
- Purpose
A
- Typical Study Sample
- Postmarketing surveillance trial of patients after approval.
- Purpose
- “Can it stay?”
- Detects rare or long-term adverse effects.
- Can result in a drug being withdrawn from market.
11
Q
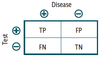
Evaluation of diagnostic tests
A
- Uses 2 × 2 table comparing test results with the actual presence of disease.
- TP = true positive
- FP = false positive
- TN = true negative
- FN = false negative
- Sensitivity and specificity are fixed properties of a test (vs. PPV and NPV).
12
Q
Sensitivity (true-positive rate)
- Definition
- Equations
A
- Definition
- Proportion of all people with disease who test positive, or the probability that a test detects disease when disease is present.
- Value approaching 100% is desirable for ruling out disease and indicates a low false-negative rate.
- High sensitivity test used for screening in diseases with low prevalence.
- Equations
- = TP / (TP + FN)
- = 1 – false-negative rate
- If sensitivity is 100%
- TP / (TP + FN) = 1
- FN = 0
- All negatives must be TNs
- SN-N-OUT = highly SeNsitive test, when Negative, rules OUT disease
13
Q
Specificity (true-negative rate)
- Definition
- Equations
A
- Definition
- Proportion of all people without disease who test negative, or the probability that a test indicates non-disease when disease is absent.
- Value approaching 100% is desirable for ruling in disease and indicates a low false-positive rate.
- High specificity test used for confirmation after a positive screening test.
- Equations
- = TN / (TN + FP)
- = 1 – false-positive rate
- If specificity is 100%
- TN / (TN + FP) = 1
- FP = 0
- All positives must be TPs
- SP-P-IN = highly SPecific test, when Positive, rules IN disease
14
Q
Positive predictive value (PPV)
- Definition
- Equation
A
- Definition
- Proportion of positive test results that are true positive.
- Probability that person actually has the disease given a positive test result.
- PPV varies directly with prevalence or pretest probability
- High pretest probability –> high PPV
- Equation
- = TP / (TP + FP)
15
Q
Negative predictive value (NPV) (51)
A
- Definition
- Proportion of negative test results that are true negative.
- Probability that person actually is disease free given a negative test result.
- NPV varies inversely with prevalence or pretest probability
- High pretest probability –> low NPV
- Equation
- = TN / (FN + TN)
16
Q
Incidence vs. prevalence
- Equations
- Comparison
A
- Equations
- Incidence rate = # of new cases in a specified time period / Population at risk during same time period
- Incidence looks at new cases (incidents).
- Prevalence = # of existing cases / Population at risk
- Prevalence looks at all current cases.
- Incidence rate = # of new cases in a specified time period / Population at risk during same time period
- Comparison
- Prevalence ≈ incidence rate × average disease duration.
- Prevalence > incidence for chronic diseases (e.g., diabetes).
- Incidence and prevalence for common cold are very similar since disease duration is short.
17
Q
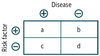
Odds ratio (OR)
- Definition
- Equations
A
- Definition
- Typically used in case-control studies.
- Odds that the group with the disease (cases) was exposed to a risk factor (a/c) divided by the odds that the group without the disease (controls) was exposed (b/d).
- Equations
- OR = (a/c) / (b/d) = ad / bc

18
Q
Relative risk (RR)
- Definition
- Equations
A
- Definition
- Typically used in cohort studies.
- Risk of developing disease in the exposed group divided by risk in the unexposed group
- e.g., if 21% of smokers develop lung cancer vs. 1% of nonsmokers, RR = 21/1 = 21
- If prevalence is low, RR ≈ OR.
- Equations
- RR = [a / (a+b)] / [c / (c+d)]
19
Q
Relative risk reduction (RRR)
- Definition
- Equations
A
- Definition
- The proportion of risk reduction attributable to the intervention as compared to a control.
- e.g., if 2% of patients who receive a flu shot develop flu, while 8% of unvaccinated patients develop the flu, then RR = 2/8 = 0.25, and RRR = 1 – RR = 0.75
- Equations
- RRR = 1 – RR
20
Q
Attributable risk (AR)
- Definition
- Equations
A
- Definition
- The difference in risk between exposed and unexposed groups, or the proportion of disease occurrences that are attributable to the exposure
- e.g., if risk of lung cancer in smokers is 21% and risk in nonsmokers is 1%, then 20% (or .20) of the 21% risk of lung cancer in smokers is attributable to smoking.
- Equations
- AR = [a / (a+b)] - [c / (c+d)]

21
Q
Absolute risk reduction (ARR)
- Definition
- Equations
A
- Definition
- The difference in risk (not the proportion) attributable to the intervention as compared to a control
- e.g., if 8% of people who receive a placebo vaccine develop flu vs. 2% of people who receive a flu vaccine, then ARR = 8% - 2% = 6% = .06.
- Equations
- ARR = [c / (c+d)] - [a / (a+b)]

22
Q
Number needed to treat
- Definition
- Equation
A
- Definition
- Number of patients who need to be treated for 1 patient to benefit.
- Equation
- NNT = 1/ARR.
23
Q
Number needed to harm
- Definition
- Equation
A
- Definition
- Number of patients who need to be exposed to a risk factor for 1 patient to be harmed.
- Equation
- NNH = 1/AR.
24
Q
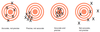
Precision
A
- The consistency and reproducibility of a test (reliability).
- The absence of random variation in a test.
- Random error—reduces precision in a test.
- Increased precision –> decreased standard deviation.
25
Accuracy
* The trueness of test measurements (validity).
* The absence of systematic error or bias in a test.
* Systematic error—reduces accuracy in a test.
26
Selection bias
* Definition
* Examples
* Berkson bias
* Loss to follow-up
* Healthy worker and volunteer biases
* Strategies to reduce bias
* Definition
* Nonrandom assignment to participate in a study group.
* Most commonly a sampling bias.
* Examples
* Berkson bias
* A study looking only at inpatients
* Loss to follow-up
* Studying a disease with early mortality
* Healthy worker and volunteer biases
* Study populations are healthier than the general population
* Strategies to reduce bias
* Randomization
* Ensure the choice of the right comparison/reference group
27
Recall bias
* Definition
* Example
* Strategy to reduce bias
* Definition
* Awareness of disorder alters recall by subjects
* Common in retrospective studies.
* Example
* Patients with disease recall exposure after learning of similar cases
* Strategy to reduce bias
* Decrease time from exposure to follow-up
28
Measurement bias
* Definition
* Example
* Strategy to reduce bias
* Definition
* Information is gathered in a way that distorts it.
* Example
* Hawthorne effect — groups who know they’re being studied behave differently than they would otherwise
* Strategy to reduce bias
* Use of placebo control groups with blinding to reduce influence of participants and researchers on experimental procedures and interpretation of outcomes
29
Procedure bias
* Definition
* Example
* Strategy to reduce bias
* Definition
* Subjects in different groups are not treated the same.
* Example
* Patients in treatment group spend more time in highly specialized hospital units
* Strategy to reduce bias
* Use of placebo control groups with blinding to reduce influence of participants and researchers on experimental procedures and interpretation of outcomes
30
Observer-expectancy bias
* Definition
* Example
* Strategy to reduce bias
* Definition
* Researcher’s belief in the efficacy of a treatment changes the outcome of that treatment
* aka Pygmalion effect; self-fulfilling prophecy
* Example
* If observer expects treatment group to show signs of recovery, then he is more likely to document positive outcomes
* Strategy to reduce bias
* Use of placebo control groups with blinding to reduce influence of participants and researchers on experimental procedures and interpretation of outcomes
31
Confounding bias
* Definition
* Example
* Strategies to reduce bias
* Definition
* When a factor is related to both the exposure and outcome, but not on the causal pathway
* Factor distorts or confuses effect of exposure on outcome
* Example
* Pulmonary disease is more common in coal workers than the general population
* However, people who work in coal mines also smoke more frequently than the general population
* Strategies to reduce bias
* Multiple/repeated studies
* Crossover studies (subjects act as their own controls)
* Matching (patients with similar characteristics in both treatment and control groups)
32
Lead-time bias
* Definition
* Example
* Strategy to reduce bias
* Definition
* Early detection is confused with increased survival
* Seen with improved screening techniques.
* Example
* Early detection makes it seem as though survival has increased, but the natural history of the disease has not changed
* Strategy to reduce bias
* Measure “back-end” survival (adjust survival according to the severity of disease at the time of diagnosis)
33
Measures of central tendency
* Mean
* Median
* Mode
* Mean = (sum of values)/(total number of values).
* Median = middle value of a list of data sorted from least to greatest.
* If there is an even number of values, the median will be the average of the middle two values.
* Mode = most common value.
34
Measures of dispersion
* Standard deviation
* Standard error of the mean
* Standard deviation = how much variability exists from the mean in a set of values.
* Standard error of the mean = an estimation of how much variability exists between the sample mean and the true population mean.
* σ = SD, n = sample size
* SEM = σ / sqrt(n)
* SEM decreases as n increases
35
Normal distribution
* Gaussian, also called bell-shaped.
* Mean = median = mode.

36
Bimodal distribution
* Suggests two different populations
* e.g., metabolic polymorphism such as fast vs. slow acetylators; suicide rate by age
37
Positive skew
* Typically, mean \> median \> mode.
* Asymmetry with longer tail on right.

38
Negative skew
* Typically, mean \< median \< mode.
* Asymmetry with longer tail on left.

39
Null Hypothesis (H0)
* Hypothesis of no difference
* e.g., there is no association between the disease and the risk factor in the population

40
Alternative Hypothesis (H1)
* Hypothesis of some difference
* e.g., there is some association between the disease and the risk factor in the population

41
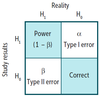
Table: Power, Type 1 Error, Type 2 Error, and Correct
42
Correct result
* Stating that there is an effect or difference when one exists
* Null hypothesis rejected in favor of alternative hypothesis
* Stating that there is not an effect or difference when none exists
* Null hypothesis not rejected
43
Type I error (α)
* Definition
* α & p
* Definition
* Also known as false-positive error
* Stating that there is an effect or difference when none exists
* Null hypothesis incorrectly rejected in favor of alternative hypothesis
* **_α_ = you s**_a_**w a difference that did not exist (e.g., convicting an innocent man).**
* α & p
* α is the probability of making a type I error.
* p is judged against a preset a level of significance (usually \< .05).
* If p \< 0.05, then there is less than a 5% chance that the data will show something that is not really there.
44
Type II error (β)
* Definition
* β & power
* Definition
* Also known as false-negative error.
* Stating that there is not an effect or difference when one exists
* Null hypothesis is not rejected when it is in fact false
* **_β_ = you were **_b_**lind to a difference that did exist (e.g., setting a guilty man free).**
* β & power
* β is the probability of making a type II error.
* β is related to statistical power (1 – β), which is the probability of rejecting the null hypothesis when it is false.
* Increase power and decrease β by:
* Increasing sample size
* **There is power in numbers.**
* Increasing expected effect size
* Increasing precision of measurement
45
Meta-analysis
* Pools data and integrates results from several similar studies to reach an overall conclusion.
* Increase statistical power.
* Limited by quality of individual studies or bias in study selection.
46
Confidence interval
* Definition
* Equation
* 95% & 99% CI
* If the 95% CI for a mean difference between 2 variables includes 0
* If the 95% CI for odds ratio or relative risk includes 1
* If the CIs between 2 groups do not overlap
* If the CIs between 2 groups overlap
* Definition
* Range of values in which a specified probability of the means of repeated samples would be expected to fall.
* Equation
* CI = range from [mean – Z(SEM)] to [mean + Z(SEM)].
* 95% & 99% CI
* For the 95% CI, Z = 1.96.
* The 95% CI (corresponding to p = .05) is often used.
* For the 99% CI, Z = 2.58.
* If the 95% CI for a mean difference between 2 variables includes 0
* Then there is no significant difference and H0 is not rejected.
* If the 95% CI for odds ratio or relative risk includes 1
* H0 is not rejected.
* If the CIs between 2 groups do not overlap
* Significant difference exists.
* If the CIs between 2 groups overlap
* Usually no significant difference exists.
47
t-test
* Checks differences between means of 2 groups.
* **Tea is meant for 2**
* Example: comparing the mean blood pressure between men and women.
48
ANOVA
* Checks differences between means of 3 or more groups.
* **3 words: ANalysis Of VAriance**
* Example: comparing the mean blood pressure between members of 3 different ethnic groups.
49
Chi-square (χ²)
* Checks difference between 2 or more percentages or proportions of categorical outcomes (not mean values).
* **Pronounce Chi-tegorical**
* Example: comparing the percentage of members of 3 different ethnic groups who have essential hypertension.
50
Pearson correlation coefficient (r)
* Definition
* Positive vs. negative r value
* Coefficient of determination
* Definition
* r is always between -1 and +1.
* The closer the absolute value of r is to 1, the stronger the linear correlation between the 2 variables.
* Positive vs. negative r value
* Positive r value --\> positive correlation.
* Negative r value --\> negative correlation.
* Coefficient of determination = r2 (value that is usually reported).
51
Disease Prevention
* Primary
* Secondary
* Tertiary
* Quaternary
* **_P_**rimary
* **_P_**revent disease occurrence (e.g., HPV vaccination).
* **_S_**econdary
* **_S_**creening early for disease (e.g., Pap smear)
* **_T_**ertiary
* **_T_**reatment to reduce disability from disease (e.g., chemotherapy)
* **Quaternary**
* Identifying patients at risk of unneccessary treatment, protecting from the harm of new interventions
52
Medicare and Medicaid
* Both
* Medicare
* Medicaid
* Both
* Federal programs that originated from amendments to the Social Security Act.
* Medicare
* Available to patients ≥ 65 years old, \< 65 with certain disabilities, and those with end-stage renal disease.
* **MedicarE is for Elderly**
* Medicaid
* Joint federal and state health assistance for people with very low income.
* **MedicaiD is for Destitute**
